Alphabet (GOOG, GOOGL) presents a fascinating case for options traders looking for single-security ideas for debit-based upside speculation. Essentially, the setup is that while GOOG stock represents a solid idea — managing to score a 56% Buy rating per the Barchart Technical Opinion indicator — the performance this month has been disappointing. However, because March tends to statistically deliver better results, GOOGL may be on speculators’ wish list.
For starters, an interesting development has been flashing in options flow. This screener focuses exclusively on big block transactions likely placed by institutional investors. From a cumulative perspective, net trade sentiment for GOOG stock has been overwhelmingly negative, especially thanks to certain sessions with pronounced surface-level pessimism.
In particular, the Feb. 12 session reads ominously, with net trade sentiment falling to almost $108 million below parity. But even here, there’s some nuance as most of the biggest transactions stemmed from credit-based (sold) calls. I wouldn’t call such transactions overtly negative; rather, it’s more like risk management with a possible bearish flavor.
In my opinion, one of the biggest clues about where GOOG stock may ultimately head in the near term stems from volatility skew. This nifty tool identifies implied volatility (IV) — or a stock’s potential kinetic output — across the strike price spectrum of a given options chain. Primarily, while the net prioritization can be argued as protecting against downside risk, the premiums paid for the insurance appear to lack urgency.
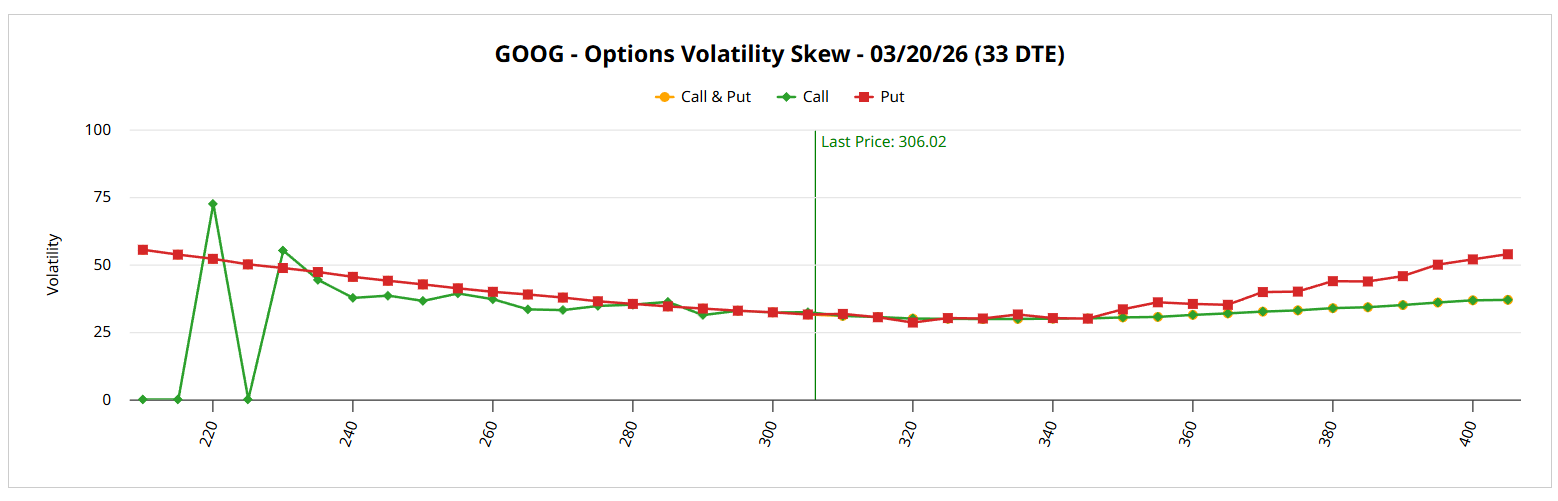
First, IV pricing for both puts and calls is relatively flat and measured near the spot price. As the volatility skew rises at the edges, it does so in a gentle controlled manner. Yes, put IV generally tends to be priced higher. However, the spread relative to call IV is very modest (and largely inconsequential), again reflecting calm waters.
This structure points to information by omission. With GOOGL stock down quite noticeably this month, a temptation exists to protect against further downside, especially amid concerns about a bubble brewing in artificial intelligence. But the smart money appears relaxed, which could open the doors to a contrarian position.
Establishing the Trading Parameters of GOOG Stock
While we now have a basic understanding of the posture of sophisticated market participants, we’re still at a loss as to how this may translate into actual price outcomes. For that, we may turn to the Black-Sholes-derived Expected Move calculator. Wall Street’s standard mechanism for pricing options forecasts a range between $286.45 and $325.59 at the March 20 expiration date.
Where does this dispersion come from? Black-Scholes assumes a world where stock market returns are lognormally distributed. Under this framework, the above range represents where GOOG stock may symmetrically land one standard deviation away from spot, while accounting for volatility and days to expiration.
From a mathematical standpoint, Black-Scholes asserts that Alphabet stock will likely end up somewhere within the prescribed dispersion when the expiration date rolls around. That’s a very reasonable assumption, if only because it would take an extraordinary catalyst to push a name like GOOGL beyond one standard deviation from spot.
However, the tension that can never be fully resolved is that all models about the unknown future are assumptions, not facts. As a first-order (observational) analysis in Black-Scholes, we can see how uncertainty is priced, not whether that pricing is “accurate,” for lack of a better word.
To be blunt, an analyst’s job isn’t to merely repeat back what various screeners say. Trading isn’t necessarily about English comprehension or playing with numbers. What we need to do is to reduce uncertainty. From the standpoint of information theory, an article doesn’t really provide value unless it helps take some possible pathways off the table.
In other words, I don’t want to just end an analysis at Black-Scholes or to rely solely on its probability of profit gauge. Again, I’m not here to reiterate the English language; I’m here to help narrow the probability space.
One mechanism through which we can achieve this goal while staying strictly with Barchart’s tools is through Seasonal Returns.
Identifying a Specific Trading Idea
As mentioned earlier, GOOG stock has been disappointing so far this month and that has been characteristic of its historical performance in February. So far, GOOG is down roughly 10% since the start of the month, with the average performance in February sitting at 3.05% below parity.
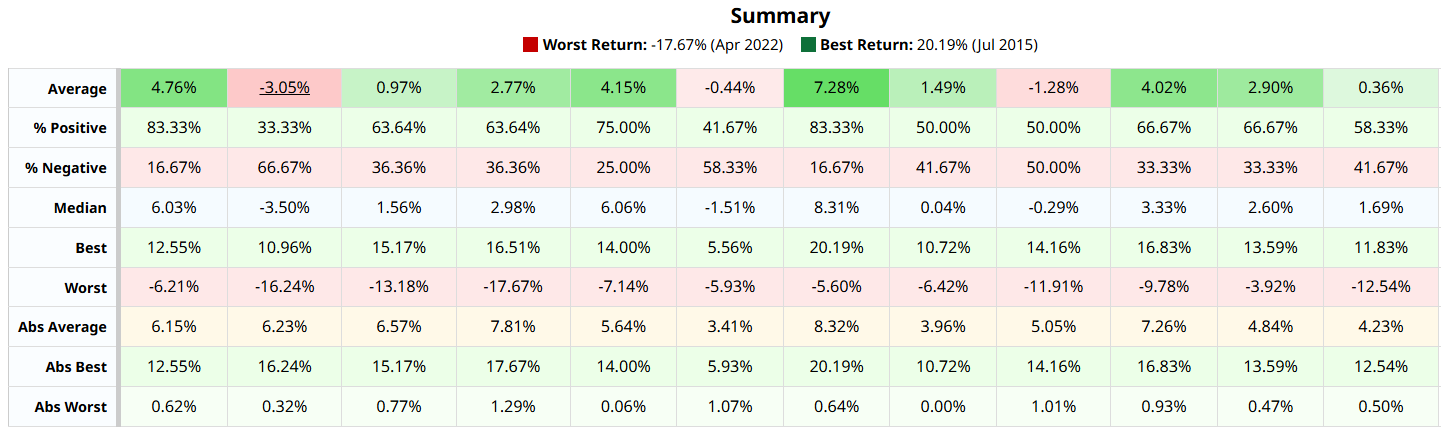
However, what’s fascinating is that in March, the average performance improves to nearly 1%. That’s still not a great read but this average is also weighed down by especially negative performances. While it’s always possible that such a rout could occur again, recall that volatility skew shows that the smart money is relaxed regarding its hedging activities.
No, sophisticated market participants aren’t inherently prescient. But if the traders with the biggest resources aren’t prioritizing downside insurance, it’s a reasonable assumption that GOOG stock may see a brighter outlook in March.
With that in mind, I’m tempted by the 310/315 bull call spread expiring March 20. For the trade to be fully profitable, GOOG stock will need to rise through the $315 strike. That’s well inside the dispersion that Black-Scholes has calculated. If the second leg is triggered accordingly, the maximum payout comes out to over 108%.
On the date of publication, Josh Enomoto did not have (either directly or indirectly) positions in any of the securities mentioned in this article. All information and data in this article is solely for informational purposes. For more information please view the Barchart Disclosure Policy here.
More news from Barchart


