The silver market delivered a historic performance last year. The long-standing $50-per-ounce all-time high, first established in 1980 and briefly challenged in 2011, was decisively taken out as prices accelerated through successive resistance levels. The move culminated in a spike to $121.78 per ounce, a level few participants had projected at the start of the year. What began as a steady bull trend turned into a vertical advance during the final stages, drawing in momentum-driven capital and forcing systematic strategies to chase the price higher.
As the rally intensified, speculative participation expanded rapidly. Open interest surged, and retail flows increased alongside leveraged fund exposure. In response to the growing volatility, the CME Group raised margin requirements multiple times, citing the need to ensure market integrity and guard against undercapitalized positions. Higher margin rates did little to cool enthusiasm in the short term, but they did increase the cost of holding leveraged longs at increasingly elevated price levels. The speed of the ascent, combined with expanding participation, created conditions typically associated with late-stage acceleration.
Markets rarely advance at that pace without eventually experiencing a meaningful correction. That does not imply the broader bull market in silver is finished. Structural demand drivers, monetary considerations, and investor allocation trends remain supportive over the intermediate term. However, after a move of this magnitude, the probability of a measurable retracement in the near future cannot be dismissed. Later in this article, we will examine the seasonal pattern, review years with similar correlated market behavior, and assess the current technical picture to frame the risk-reward profile from here.
Technical Picture
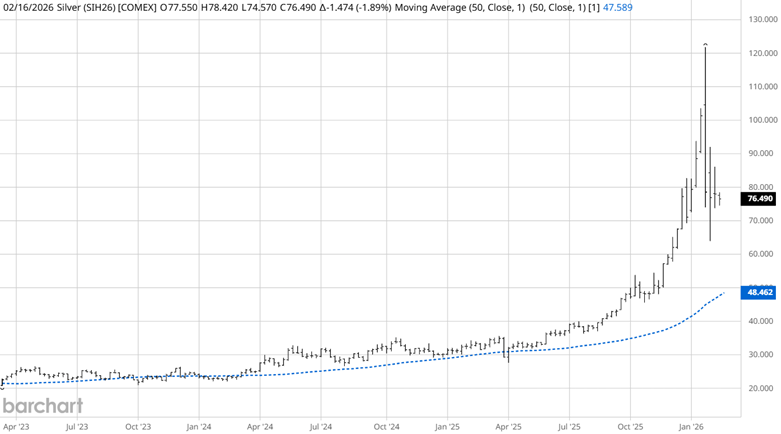
Source: Barchart
Silver bulls certainly had their run! Going back 3 years, we can see that the weekly nearby silver chart has respected its 50-week simple moving average (SMA). Generally, when a runaway market gets this far from a popular mean, the natural tendency is to retrace towards it. Which is why I don’t believe the bull market has ended, yet. Many of our markets are undergoing similar trend transitions. And who can blame them? Their profits have been amazing. Is it possible that the unwinding of the Yen Carry Trade is impacting trading risk? Time will tell…
Correlated Market Years
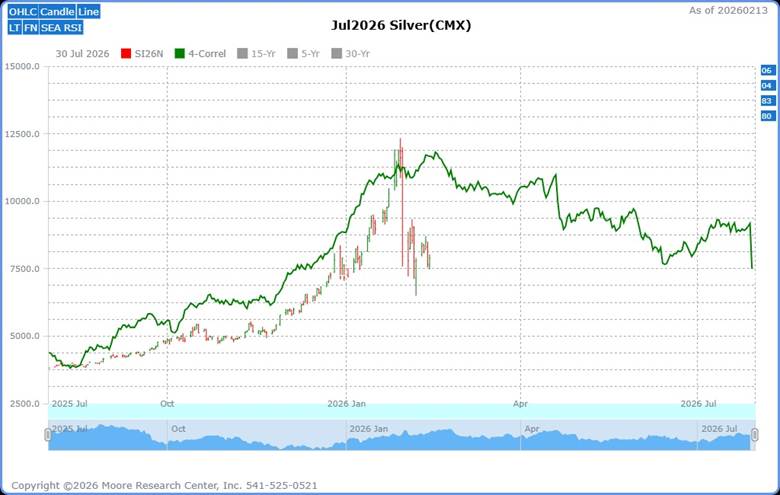
Source: Moore Research Center, Inc. (MRCI)
MRCI’s research on correlated market years alongside seasonal patterns significantly enhances the predictive power of seasonal trading by providing context for historical trends. Instead of relying on a simple, long-term average (which may mix bull and bear markets), this approach filters for years that behaved similarly to the current, ongoing market, resulting in higher-probability, more relevant trading signals.
Currently, the July silver futures contract is experiencing a series of correlated years (green line), suggesting a significant downward move within 30 days. All four years have a correlation rate of >= 84%. The years are 1980 (95%), 1983 (87%), 2004 (92%), and 2006 (90%). There are also three years that “almost” made the team: 1974 (80%), 2008 (83%), and 2023 (80%).
Seasonal Pattern
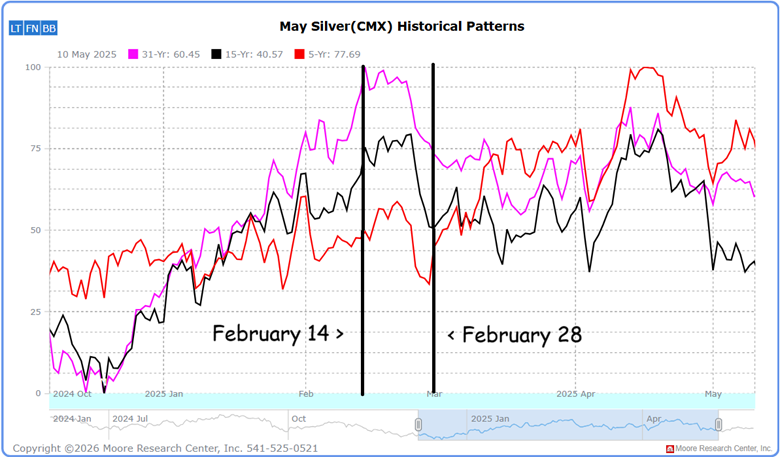
Source: MRCI
MRCI seasonal research over 31 years, 15 years, and 5 years has shown the same significant price decline beginning after Valentine’s Day (February 14) and continuing through the end of February. Apparently, there is no love for silver after Valentine’s Day.
By observation, the weekly chart shows silver extremely far above a popular mean. Currently, the silver market is trading similarly to the 4 correlated years, which has led to a significant move down, and the multi-year seasonal sell pattern ties this setup together.
As a crucial reminder, while seasonal patterns can provide valuable insights, they should not be the basis for trading decisions. Traders must consider various technical and fundamental indicators, risk management strategies, and market conditions to make informed, balanced trading decisions.
Assets to Participate in the Silver Move
Traders and investors seeking a bullish position in the silver market can access several key assets, including silver futures contracts (e.g., COMEX standard size SI, micro-size SO), options on futures and equities are available as well, and silver ETFs like the iShares Silver Trust (SLV) or Physical Silver Shares ETF (SIVR), which track spot silver prices and offer liquid, cost-efficient exposure without direct metal storage.
In Closing…
Last year’s decisive breakout above the $50 all-time high and the surge to $121.78 per ounce marked a historic moment for silver. Still, the speed of that advance, the spike in speculative participation, and repeated margin hikes by the CME Group are facts that seasoned traders cannot ignore. The weekly chart’s extended distance from its 50-week moving average, the high-correlation years pointing to potential downside pressure, and the well-documented post–Valentine’s Day seasonal weakness all argue for respect. None of this proves the bull market is over. It does, however, underscore that silver has earned its nickname as the “widow maker” for a reason. If you plan to participate—whether through futures, options, or ETFs—do the work. Study the seasonals, the correlations, the technical structure, and the macro backdrop. Opportunity is clearly present, but so is risk. In this market, discipline and position sizing matter just as much as conviction.
On the date of publication, Don Dawson did not have (either directly or indirectly) positions in any of the securities mentioned in this article. All information and data in this article is solely for informational purposes. For more information please view the Barchart Disclosure Policy here.
More news from Barchart


