Visa (V) is suffering badly in the market and it’s not exactly surprising why. With economic conditions imposing an unhelpful backdrop for the transaction processing services giant, Visa faces a sharp credibility challenge. Indeed, the Barchart Technical Opinion indicator rates V stock as a 100% Strong Sell, which carries the highest risk for the security continuing its downward trend in the short term.
So, within this context, the public money has been understandably skeptical. Since the beginning of the year, V stock lost more than 10%, which is historically a terrible performance. It’s unusual to see the security fall into the red for both January and February (thus far). However, what’s really interesting is that the smart money doesn’t seem particularly perturbed.
Basically, there’s a discrepancy between what the public thinks versus what sophisticated players are thinking — and I would argue that such discrepancies are gold.
Initially, the bullish thesis may look a bit confusing because of options flow. Net trade sentiment for the most recent (Friday) session was almost $2.15 million below parity. However, the key nuance is that the bulk of the bearish transactions that we have seen — the debit-based puts — expire soon on Feb. 20. Once that negativity clears, I would expect clearer weather, especially for the March monthly expiration date.
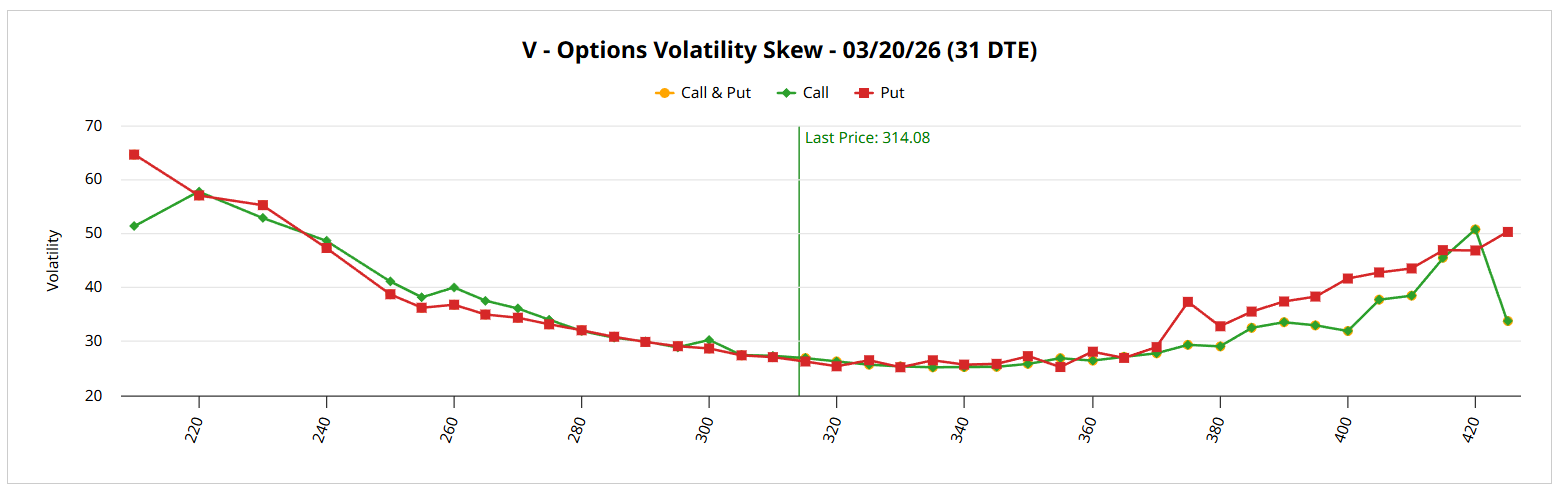
For me, the biggest signal comes from volatility skew. This screener identifies implied volatility (IV) — or a stock’s potential kinetic output — across the strike price spectrum of a given options chain. For the March 20 expiration date, the skew is completely unremarkable, which I believe represents information by omission.
Again, V stock is off to a historically rough start to the new year. Despite this circumstance, volatility skew at the strikes near the spot price is relatively flat and muted. Yes, put IV rises on both ends of the spectrum but the main factor to keep in mind is that the rise in curvature is steady and controlled. Further, there is little separation from call IV, indicating a lack of urgency.
Yes, there’s hedging going on but it’s very much standard fare.
Establishing the Trading Parameters of V Stock
While we now have a working understanding of smart money sentiment, we still need to know how this may translate into actual price outcomes. For that, we may turn to the Black-Sholes-derived Expected Move calculator. Wall Street’s standard mechanism for pricing options forecasts a range between $296.47 and $331.42 at the March 20 expiration date.
Where does this dispersion come from? Black-Scholes assumes a world where stock market returns are lognormally distributed. Under this framework, the above range represents where V stock may symmetrically land one standard deviation away from spot while accounting for volatility and days to expiration.
From its formulaic perspective, Black-Scholes claims that Visa stock will likely end up somewhere within the prescribed dispersion when the expiration date rolls around. That’s a very reasonable assumption, if only because it would take an extraordinary catalyst to drive a name like Visa beyond one standard deviation from spot.
However, we also need to recognize that the dispersion implies an absolute spread (within the standard deviation envelope) of roughly 12%. When broken down, the trader is left with the possibility that Visa stock can either go up 5.52% or go down 5.52%.
So, the deadlock is that first-order observations tell us how the market is pricing uncertainty. But our job as analysts is to whittle down as much uncertainty as possible; otherwise, we would just be reiterating screened information back at the audience, which doesn’t count as analysis but only as narrative reframing.
Staying strictly first order and exclusively using Barchart tools, one mechanism that we have available is the Seasonal Returns screener.
Narrowing Down the Probability Space
Remember when I said earlier that V stock was suffering a historically bad performance? I got this information from this nifty heatmap, which shows that Visa suffering a down month in both January and February is exceedingly rare. Since 2010, this has only happened once in 2016.
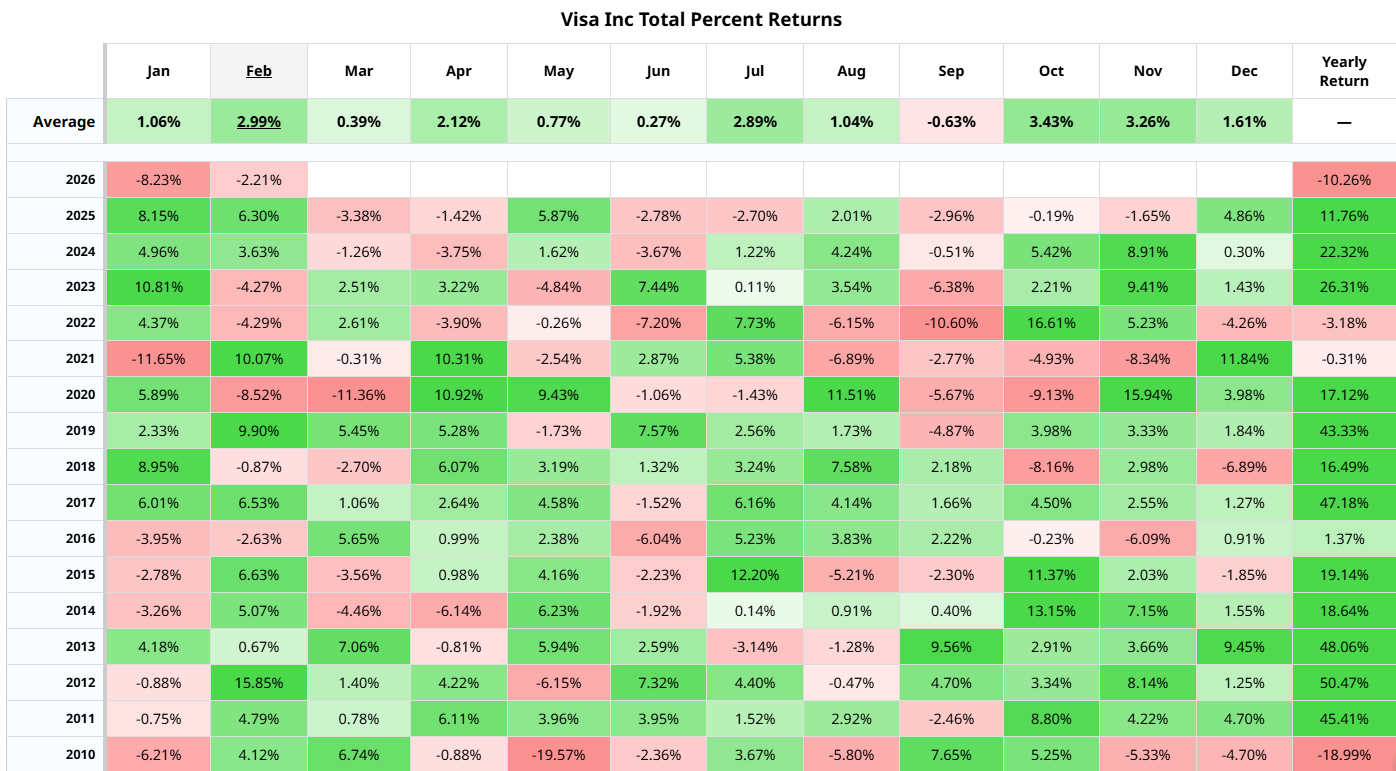
However, what’s really fascinating is that in March of the year, V stock bounced back 5.65%. Now, I don’t know if the same thing is going to happen again. It is interesting — however coincidental — that the bounce-back rate is almost identical to the magnitude of movement that Black-Scholes is calling for.
True, March isn’t statistically the strongest month. From an enumerative perspective, it may be that Visa stock is primed for a recovery. I’m not just referencing the 2016 bounce back but also the relaxed posture from the volatility skew.
If you accept the premise, the 320/325 bull call spread expiring March 20 may offer an ideal balance between reward and probabilistic credibility.
On the date of publication, Josh Enomoto did not have (either directly or indirectly) positions in any of the securities mentioned in this article. All information and data in this article is solely for informational purposes. For more information please view the Barchart Disclosure Policy here.
More news from Barchart
- Options Traders’ Relaxed Hedging Against Visa (V) Stock May Offer a Hidden Bullish Signal
- Analysts See Domino's Pizza Stock As Too Cheap Ahead of Earnings Next Week
- Adobe Systems Bear Put Spread Could Return 163% in this Down Move
- Speculators Fell in Love—The Market Didn’t: Silver After Valentine’s Day


