
Healthcare services company Chemed Corporation (NYSE: CHE) met Wall Street’s revenue expectations in Q3 CY2025, with sales up 3.1% year on year to $624.9 million. Its non-GAAP profit of $5.27 per share was 1.8% below analysts’ consensus estimates.
Is now the time to buy Chemed? Find out by accessing our full research report, it’s free for active Edge members.
Chemed (CHE) Q3 CY2025 Highlights:
- Revenue: $624.9 million vs analyst estimates of $626 million (3.1% year-on-year growth, in line)
- Adjusted EPS: $5.27 vs analyst expectations of $5.37 (1.8% miss)
- Adjusted EBITDA: $109 million vs analyst estimates of $113.9 million (17.4% margin, 4.3% miss)
- Adjusted EPS guidance for the full year is $22.15 at the midpoint
- Operating Margin: 12%, down from 15.2% in the same quarter last year
- Free Cash Flow Margin: 5.9%, down from 12.7% in the same quarter last year
- Sales Volumes were up 2.5% year on year
- Market Capitalization: $6.34 billion
Company Overview
With a unique business model combining end-of-life care and household services, Chemed (NYSE: CHE) operates two distinct businesses: VITAS, which provides hospice care for terminally ill patients, and Roto-Rooter, which offers plumbing and water restoration services.
Revenue Growth
Reviewing a company’s long-term sales performance reveals insights into its quality. Any business can put up a good quarter or two, but many enduring ones grow for years. Unfortunately, Chemed’s 4.1% annualized revenue growth over the last five years was mediocre. This was below our standard for the healthcare sector and is a poor baseline for our analysis.
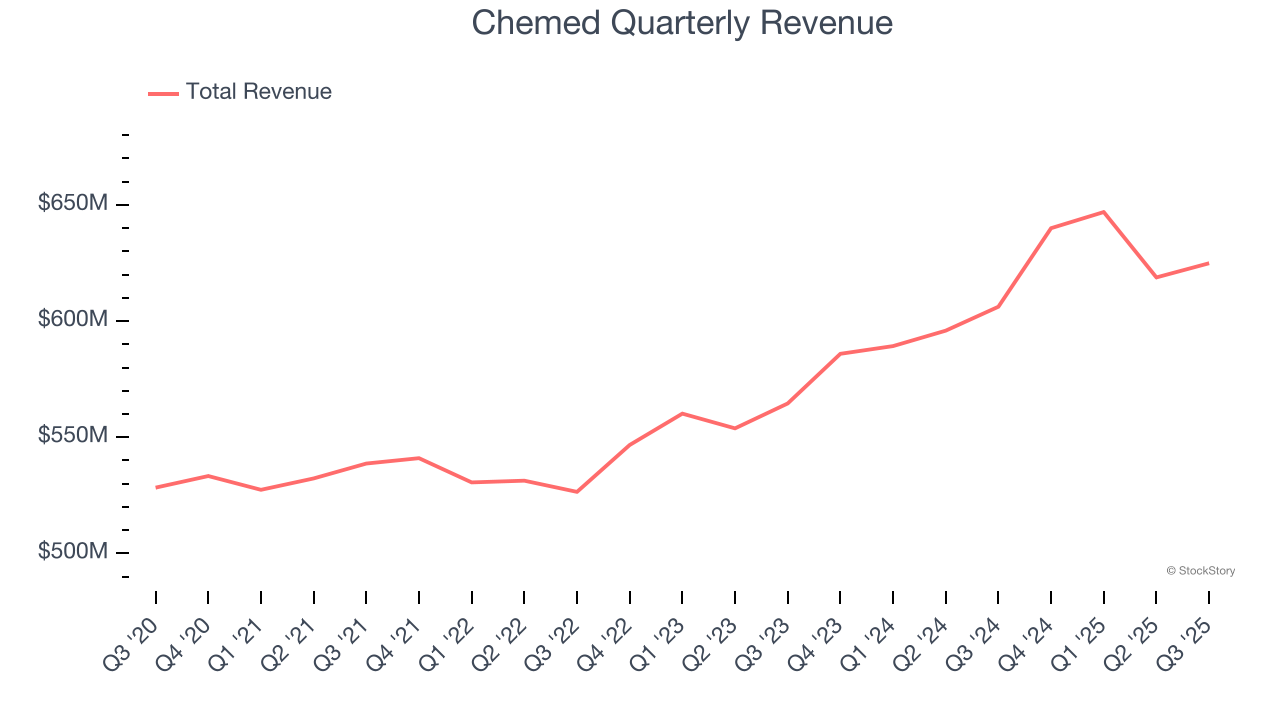
We at StockStory place the most emphasis on long-term growth, but within healthcare, a half-decade historical view may miss recent innovations or disruptive industry trends. Chemed’s annualized revenue growth of 6.6% over the last two years is above its five-year trend, but we were still disappointed by the results. 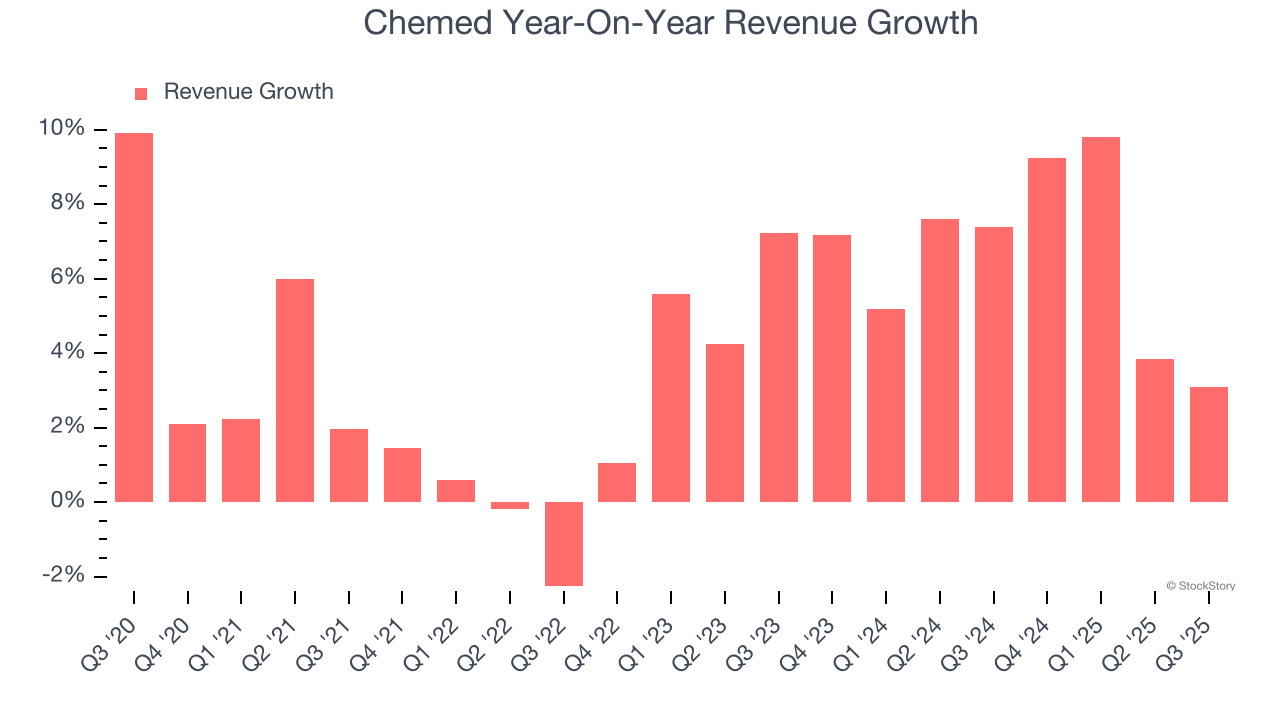
We can better understand the company’s revenue dynamics by analyzing its number of billable days, which reached 2.05 million in the latest quarter. Over the last two years, Chemed’s billable days averaged 2.5% year-on-year growth. Because this number is lower than its revenue growth, we can see the company benefited from price increases. 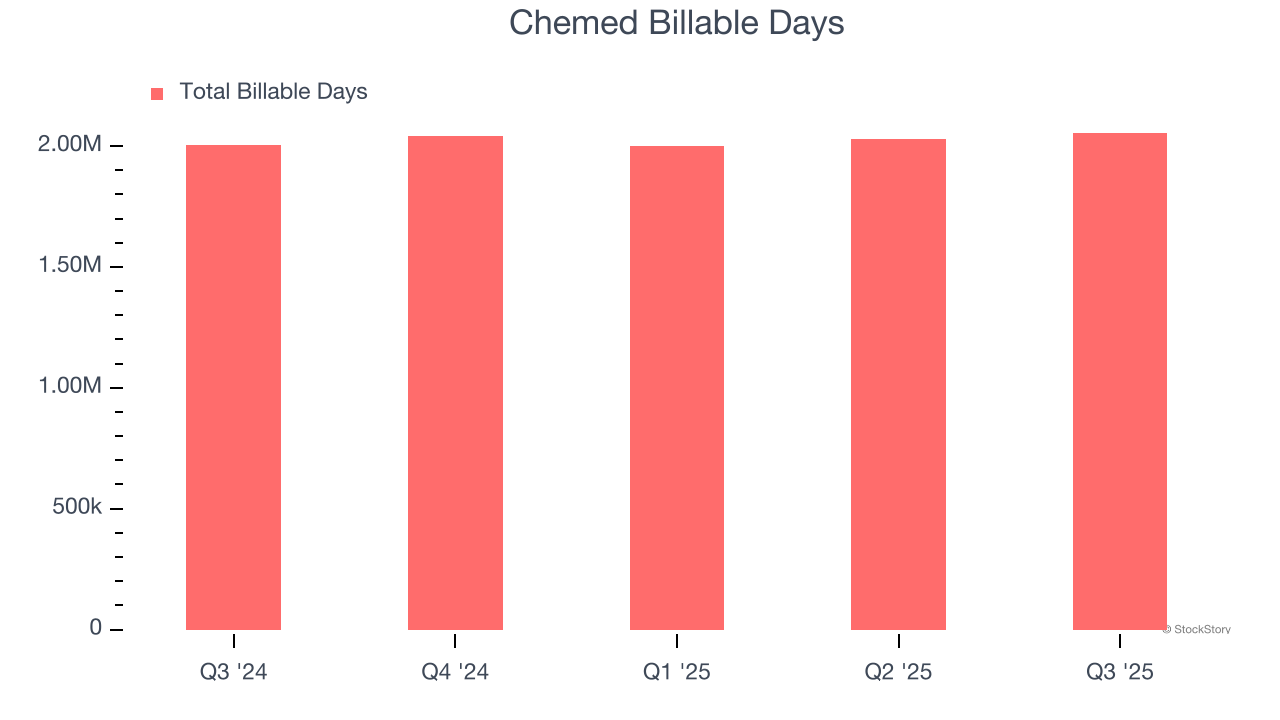
This quarter, Chemed grew its revenue by 3.1% year on year, and its $624.9 million of revenue was in line with Wall Street’s estimates.
Looking ahead, sell-side analysts expect revenue to grow 5.6% over the next 12 months, similar to its two-year rate. Despite the slowdown, this projection is above the sector average and indicates the market is baking in some success for its newer products and services.
Software is eating the world and there is virtually no industry left that has been untouched by it. That drives increasing demand for tools helping software developers do their jobs, whether it be monitoring critical cloud infrastructure, integrating audio and video functionality, or ensuring smooth content streaming. Click here to access a free report on our 3 favorite stocks to play this generational megatrend.
Operating Margin
Operating margin is an important measure of profitability as it shows the portion of revenue left after accounting for all core expenses – everything from the cost of goods sold to advertising and wages. It’s also useful for comparing profitability across companies with different levels of debt and tax rates because it excludes interest and taxes.
Chemed has managed its cost base well over the last five years. It demonstrated solid profitability for a healthcare business, producing an average operating margin of 15.6%.
Looking at the trend in its profitability, Chemed’s operating margin decreased by 4.3 percentage points over the last five years. This raises questions about the company’s expense base because its revenue growth should have given it leverage on its fixed costs, resulting in better economies of scale and profitability.
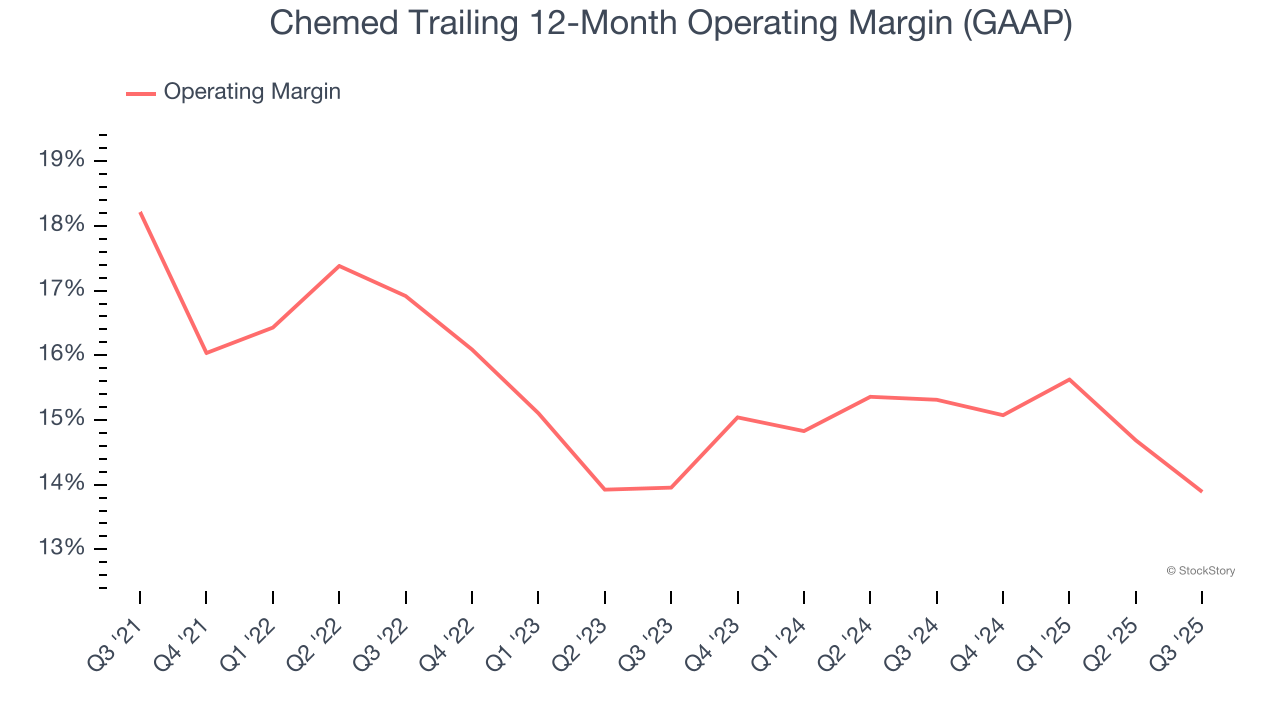
This quarter, Chemed generated an operating margin profit margin of 12%, down 3.2 percentage points year on year. This contraction shows it was less efficient because its expenses grew faster than its revenue.
Earnings Per Share
Revenue trends explain a company’s historical growth, but the long-term change in earnings per share (EPS) points to the profitability of that growth – for example, a company could inflate its sales through excessive spending on advertising and promotions.
Chemed’s decent 5.1% annual EPS growth over the last five years aligns with its revenue performance. This tells us it maintained its per-share profitability as it expanded.
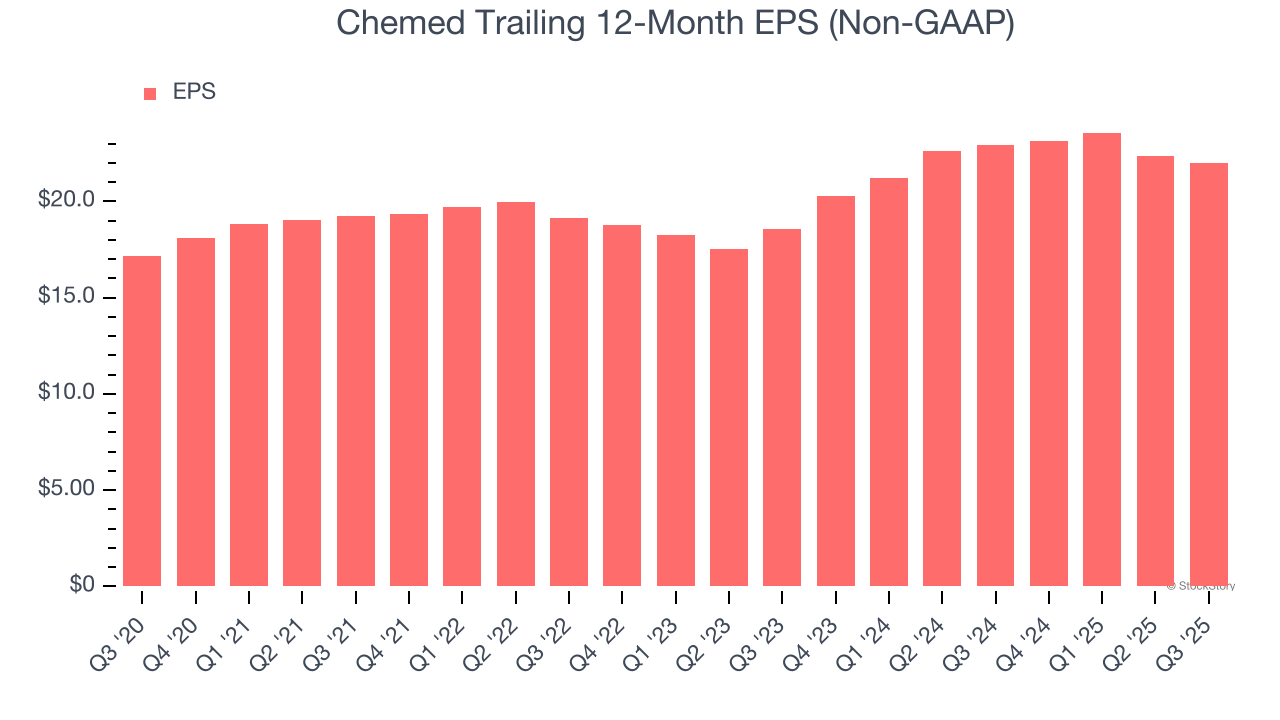
In Q3, Chemed reported adjusted EPS of $5.27, down from $5.64 in the same quarter last year. This print slightly missed analysts’ estimates, but we care more about long-term adjusted EPS growth than short-term movements. Over the next 12 months, Wall Street expects Chemed’s full-year EPS of $22 to grow 12%.
Key Takeaways from Chemed’s Q3 Results
We struggled to find many positives in these results. EBITDA and EPS both missed. Overall, this quarter could have been better. The stock traded down 4.8% to $418.19 immediately following the results.
The latest quarter from Chemed’s wasn’t that good. One earnings report doesn’t define a company’s quality, though, so let’s explore whether the stock is a buy at the current price. If you’re making that decision, you should consider the bigger picture of valuation, business qualities, as well as the latest earnings. We cover that in our actionable full research report which you can read here, it’s free for active Edge members.


