
Scientific instrument company Bruker (NASDAQ: BRKR). announced better-than-expected revenue in Q3 CY2025, but sales were flat year on year at $860.5 million. On the other hand, the company’s full-year revenue guidance of $3.43 billion at the midpoint came in 0.5% below analysts’ estimates. Its non-GAAP profit of $0.45 per share was 38.6% above analysts’ consensus estimates.
Is now the time to buy Bruker? Find out by accessing our full research report, it’s free for active Edge members.
Bruker (BRKR) Q3 CY2025 Highlights:
- Revenue: $860.5 million vs analyst estimates of $845.7 million (flat year on year, 1.8% beat)
- Adjusted EPS: $0.45 vs analyst estimates of $0.32 (38.6% beat)
- The company dropped its revenue guidance for the full year to $3.43 billion at the midpoint from $3.47 billion, a 1.2% decrease
- Management lowered its full-year Adjusted EPS guidance to $1.88 at the midpoint, a 6.3% decrease
- Operating Margin: -6%, down from 7.8% in the same quarter last year
- Free Cash Flow was -$54.1 million, down from $5.8 million in the same quarter last year
- Organic Revenue fell 4.5% year on year vs analyst estimates of 6.9% declines (235.9 basis point beat)
- Market Capitalization: $5.91 billion
Company Overview
With roots dating back to the pioneering days of nuclear magnetic resonance technology, Bruker (NASDAQ: BRKR) develops and manufactures high-performance scientific instruments that enable researchers and industrial analysts to explore materials at microscopic, molecular, and cellular levels.
Revenue Growth
Examining a company’s long-term performance can provide clues about its quality. Any business can experience short-term success, but top-performing ones enjoy sustained growth for years. Thankfully, Bruker’s 11.9% annualized revenue growth over the last five years was decent. Its growth was slightly above the average healthcare company and shows its offerings resonate with customers.
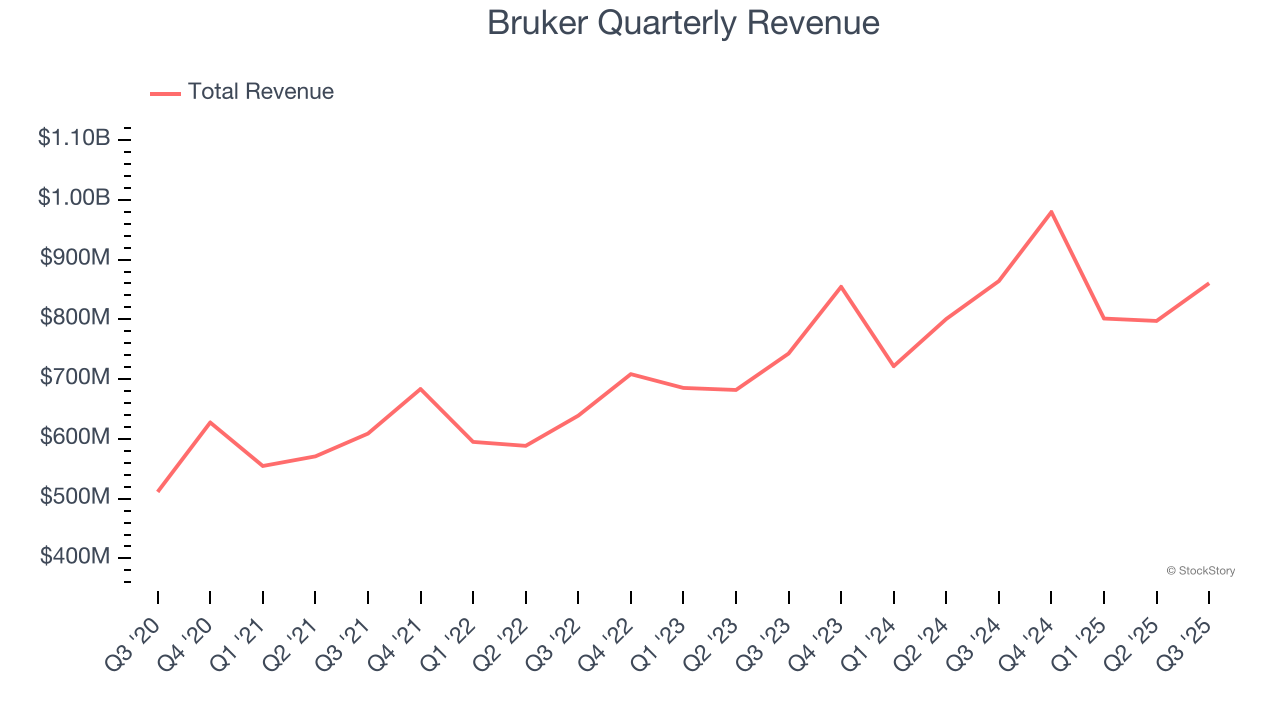
We at StockStory place the most emphasis on long-term growth, but within healthcare, a half-decade historical view may miss recent innovations or disruptive industry trends. Bruker’s annualized revenue growth of 10.5% over the last two years is below its five-year trend, but we still think the results were respectable. 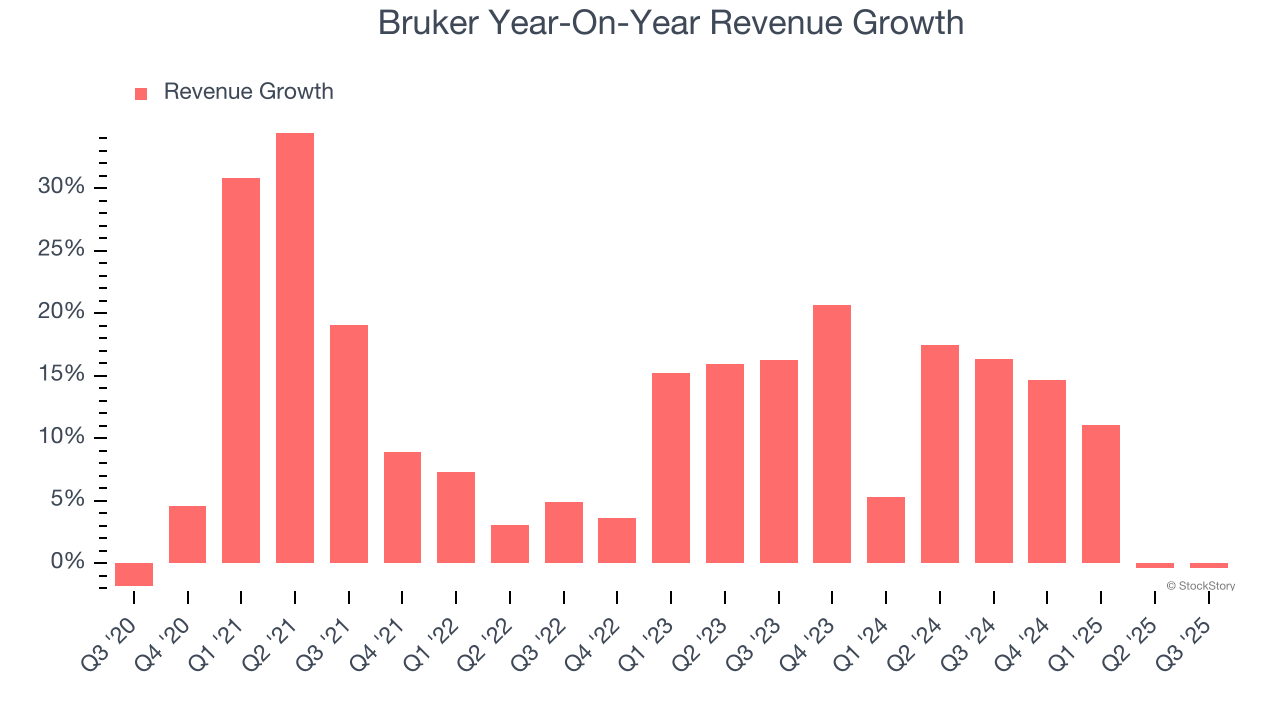
We can better understand the company’s sales dynamics by analyzing its organic revenue, which strips out one-time events like acquisitions and currency fluctuations that don’t accurately reflect its fundamentals. Over the last two years, Bruker’s organic revenue averaged 2.9% year-on-year growth. Because this number is lower than its two-year revenue growth, we can see that some mixture of acquisitions and foreign exchange rates boosted its headline results. 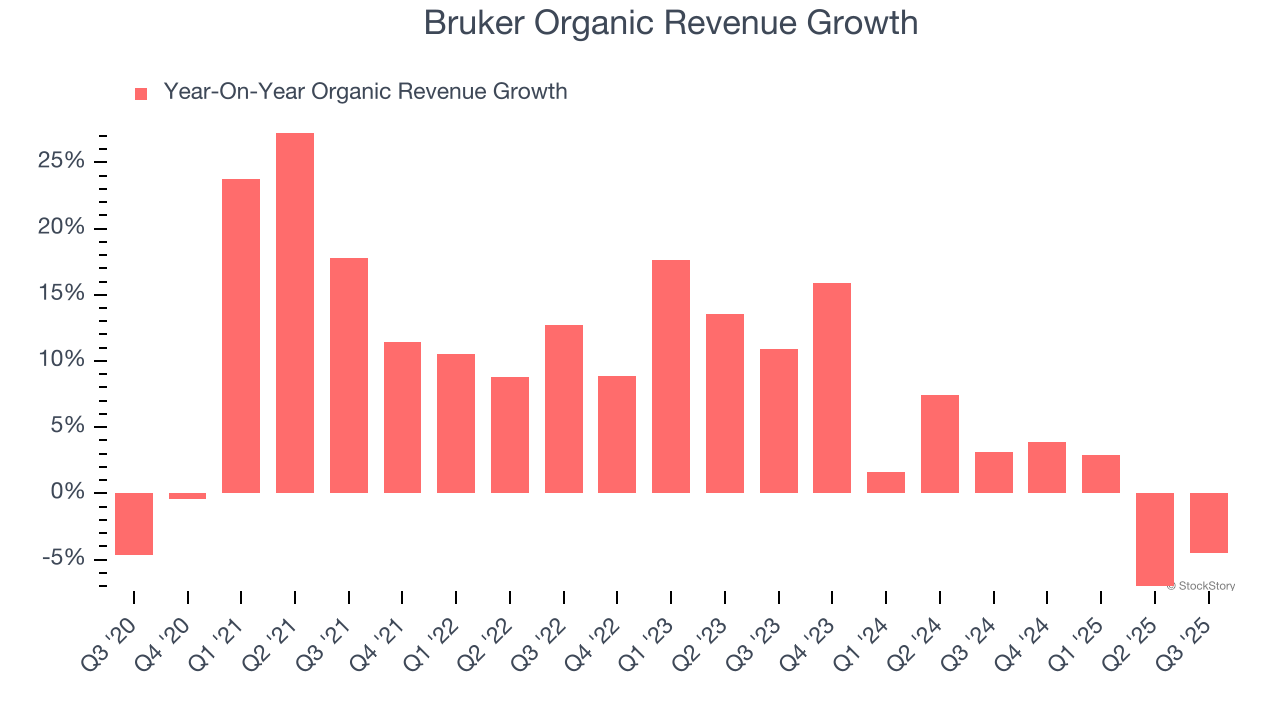
This quarter, Bruker’s $860.5 million of revenue was flat year on year but beat Wall Street’s estimates by 1.8%.
Looking ahead, sell-side analysts expect revenue to grow 1.1% over the next 12 months, a deceleration versus the last two years. This projection is underwhelming and indicates its products and services will see some demand headwinds.
The 1999 book Gorilla Game predicted Microsoft and Apple would dominate tech before it happened. Its thesis? Identify the platform winners early. Today, enterprise software companies embedding generative AI are becoming the new gorillas. a profitable, fast-growing enterprise software stock that is already riding the automation wave and looking to catch the generative AI next.
Operating Margin
Bruker has done a decent job managing its cost base over the last five years. The company has produced an average operating margin of 11.4%, higher than the broader healthcare sector.
Looking at the trend in its profitability, Bruker’s operating margin decreased by 15.1 percentage points over the last five years. The company’s two-year trajectory also shows it failed to get its profitability back to the peak as its margin fell by 14.6 percentage points. This performance was poor no matter how you look at it - it shows its expenses were rising and it couldn’t pass those costs onto its customers.
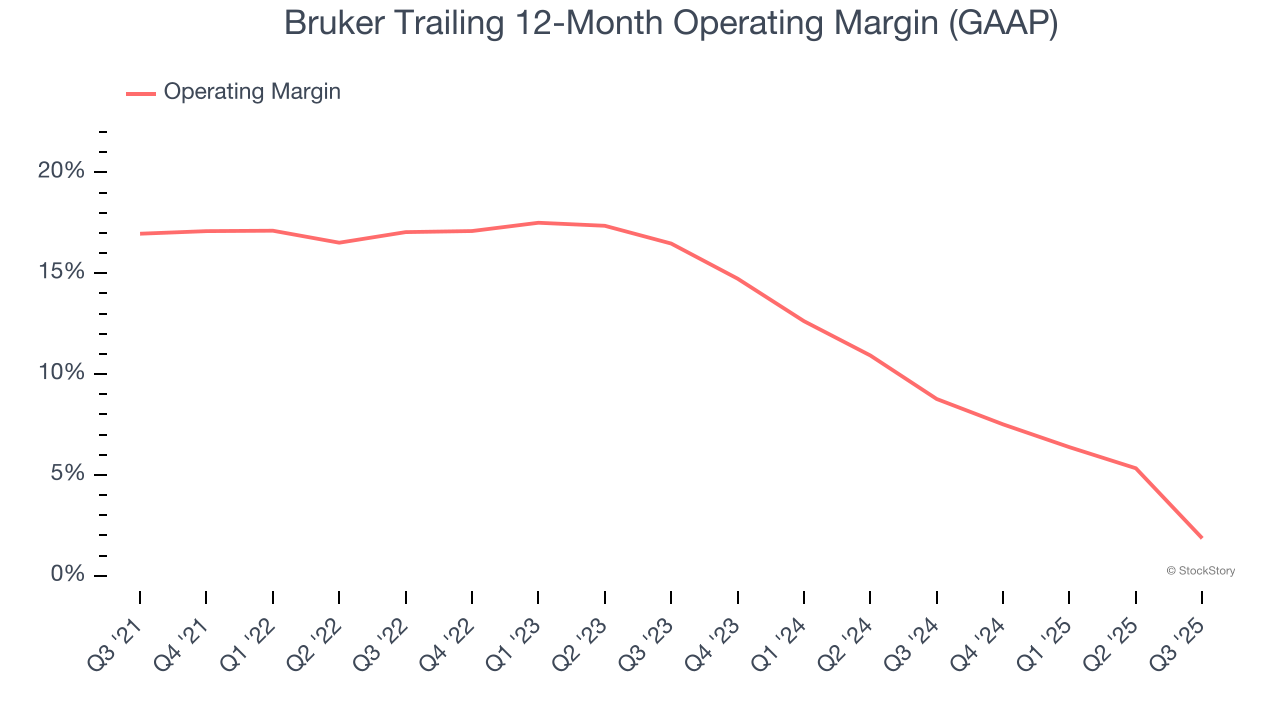
This quarter, Bruker generated an operating margin profit margin of negative 6%, down 13.9 percentage points year on year. This contraction shows it was less efficient because its expenses increased relative to its revenue.
Earnings Per Share
Revenue trends explain a company’s historical growth, but the long-term change in earnings per share (EPS) points to the profitability of that growth – for example, a company could inflate its sales through excessive spending on advertising and promotions.
Bruker’s EPS grew at a solid 9% compounded annual growth rate over the last five years. However, this performance was lower than its 11.9% annualized revenue growth, telling us the company became less profitable on a per-share basis as it expanded due to non-fundamental factors such as interest expenses and taxes.
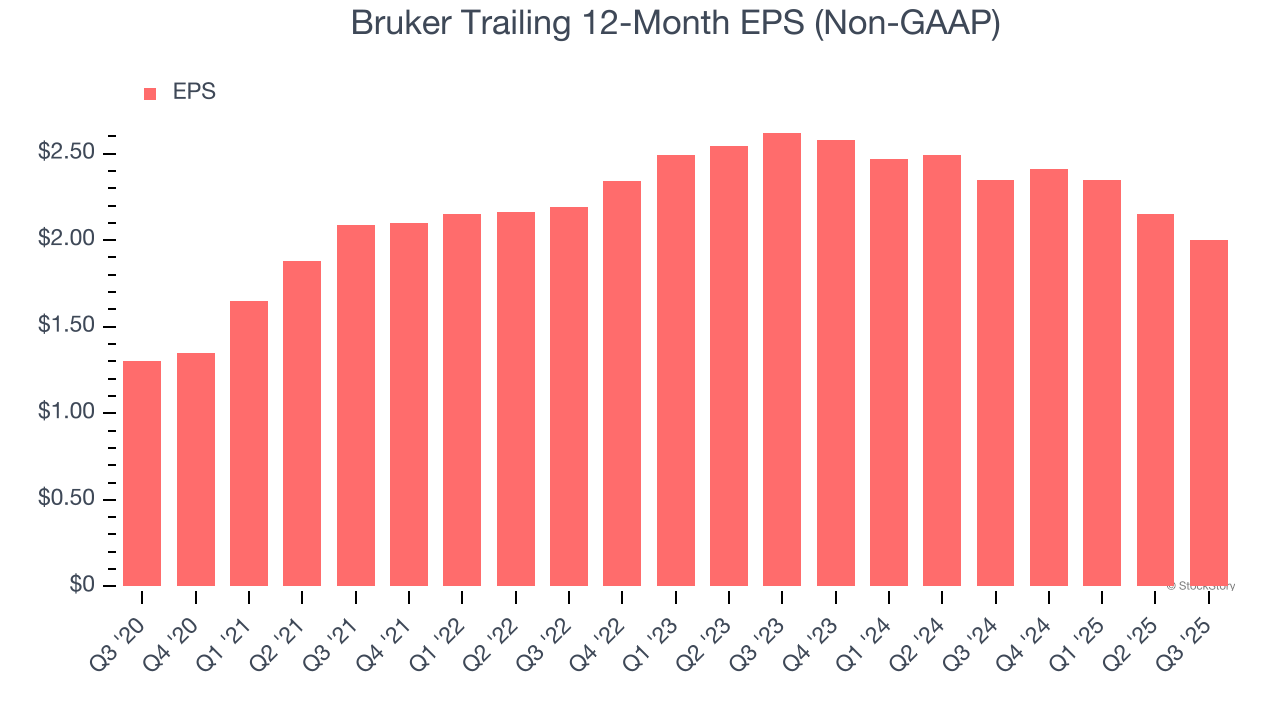
We can take a deeper look into Bruker’s earnings quality to better understand the drivers of its performance. As we mentioned earlier, Bruker’s operating margin declined by 15.1 percentage points over the last five years. This was the most relevant factor (aside from the revenue impact) behind its lower earnings; interest expenses and taxes can also affect EPS but don’t tell us as much about a company’s fundamentals.
In Q3, Bruker reported adjusted EPS of $0.45, down from $0.60 in the same quarter last year. Despite falling year on year, this print easily cleared analysts’ estimates. Over the next 12 months, Wall Street expects Bruker’s full-year EPS of $2 to grow 21.6%.
Key Takeaways from Bruker’s Q3 Results
It was good to see Bruker beat analysts’ EPS expectations this quarter on better-than-expected organic revenue growth. On the other hand, its full-year EPS guidance missed and its full-year revenue guidance fell slightly short of Wall Street’s estimates. The outlook is weighing on shares, and the stock traded down 3.7% to $37.51 immediately following the results.
Should you buy the stock or not? The latest quarter does matter, but not nearly as much as longer-term fundamentals and valuation, when deciding if the stock is a buy. We cover that in our actionable full research report which you can read here, it’s free for active Edge members.


