
Insurance brokerage firm Arthur J. Gallagher (NYSE: AJG) missed Wall Street’s revenue expectations in Q3 CY2025, but sales rose 21.2% year on year to $3.37 billion. Its non-GAAP profit of $2.32 per share was 8.5% below analysts’ consensus estimates.
Is now the time to buy Arthur J. Gallagher? Find out by accessing our full research report, it’s free for active Edge members.
Arthur J. Gallagher (AJG) Q3 CY2025 Highlights:
- Revenue: $3.37 billion vs analyst estimates of $3.46 billion (21.2% year-on-year growth, 2.6% miss)
- Adjusted EPS: $2.32 vs analyst expectations of $2.54 (8.5% miss)
- Adjusted EBITDA: $1.02 billion vs analyst estimates of $1.09 billion (30.2% margin, 7% miss)
- Operating Margin: 10.3%, down from 14.5% in the same quarter last year
- Free Cash Flow Margin: 20.6%, down from 32.3% in the same quarter last year
- Market Capitalization: $66.32 billion
Company Overview
Founded in 1927 and operating in approximately 130 countries through direct operations and correspondent networks, Arthur J. Gallagher (NYSE: AJG) provides insurance brokerage, reinsurance, consulting, and third-party claims settlement services to businesses and individuals worldwide.
Revenue Growth
A company’s long-term sales performance can indicate its overall quality. Any business can have short-term success, but a top-tier one grows for years.
With $12.98 billion in revenue over the past 12 months, Arthur J. Gallagher is a behemoth in the business services sector and benefits from economies of scale, giving it an edge in distribution. This also enables it to gain more leverage on its fixed costs than smaller competitors and the flexibility to offer lower prices.
As you can see below, Arthur J. Gallagher’s sales grew at an exceptional 14.3% compounded annual growth rate over the last five years. This is a great starting point for our analysis because it shows Arthur J. Gallagher’s demand was higher than many business services companies.

Long-term growth is the most important, but within business services, a half-decade historical view may miss new innovations or demand cycles. Arthur J. Gallagher’s annualized revenue growth of 16% over the last two years is above its five-year trend, suggesting its demand was strong and recently accelerated. 
We can better understand the company’s revenue dynamics by analyzing its most important segment, Insurance Brokerage. Over the last two years, Arthur J. Gallagher’s Insurance Brokerage revenue (commissions and fees) averaged 16.8% year-on-year growth. 
This quarter, Arthur J. Gallagher generated an excellent 21.2% year-on-year revenue growth rate, but its $3.37 billion of revenue fell short of Wall Street’s high expectations.
Looking ahead, sell-side analysts expect revenue to grow 28.9% over the next 12 months, an improvement versus the last two years. This projection is eye-popping for a company of its scale and suggests its newer products and services will catalyze better top-line performance.
Microsoft, Alphabet, Coca-Cola, Monster Beverage—all began as under-the-radar growth stories riding a massive trend. We’ve identified the next one: a profitable AI semiconductor play Wall Street is still overlooking. Go here for access to our full report.
Adjusted Operating Margin
Adjusted operating margin is a key measure of profitability. Think of it as net income (the bottom line) excluding the impact of non-recurring expenses, taxes, and interest on debt - metrics less connected to business fundamentals.
Arthur J. Gallagher has been a well-oiled machine over the last five years. It demonstrated elite profitability for a business services business, boasting an average adjusted operating margin of 23.5%.
Looking at the trend in its profitability, Arthur J. Gallagher’s adjusted operating margin rose by 7 percentage points over the last five years, as its sales growth gave it immense operating leverage.
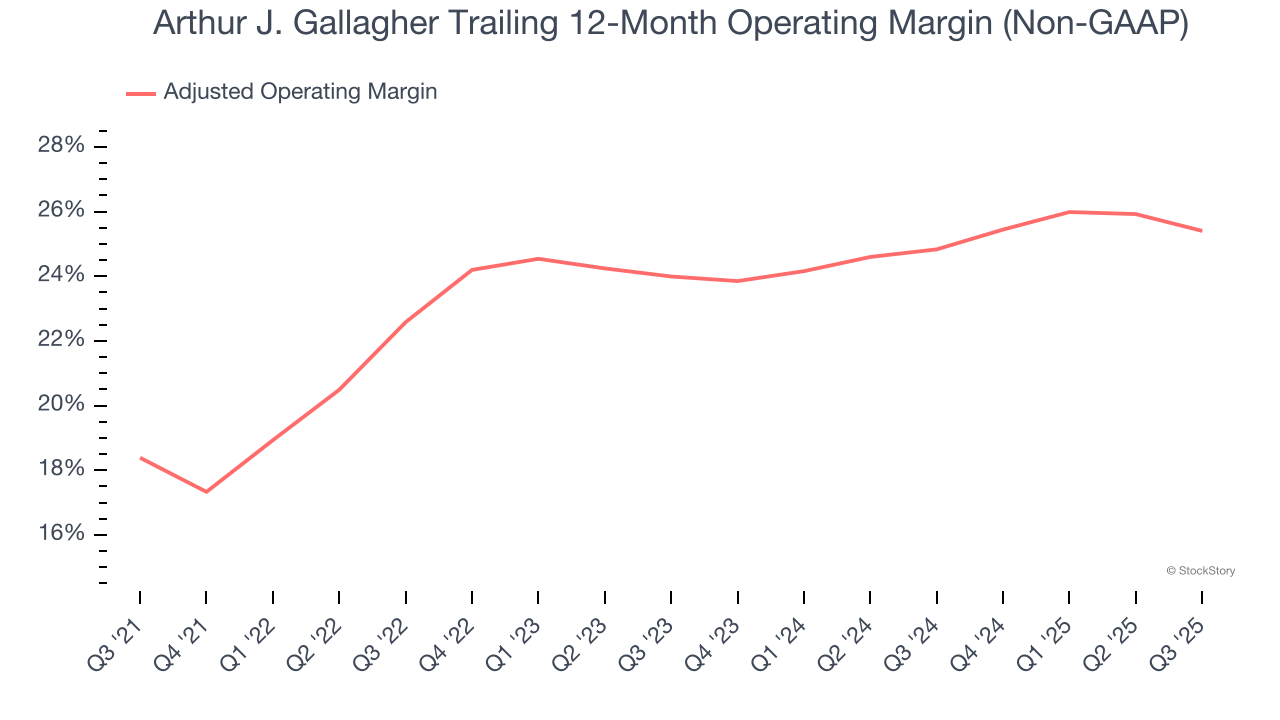
In Q3, Arthur J. Gallagher generated an adjusted operating margin profit margin of 21.7%, down 1.5 percentage points year on year. This reduction is quite minuscule and indicates the company’s overall cost structure has been relatively stable.
Earnings Per Share
We track the long-term change in earnings per share (EPS) for the same reason as long-term revenue growth. Compared to revenue, however, EPS highlights whether a company’s growth is profitable.
Arthur J. Gallagher’s EPS grew at an astounding 18.7% compounded annual growth rate over the last five years, higher than its 14.3% annualized revenue growth. This tells us the company became more profitable on a per-share basis as it expanded.

Diving into Arthur J. Gallagher’s quality of earnings can give us a better understanding of its performance. As we mentioned earlier, Arthur J. Gallagher’s adjusted operating margin declined this quarter but expanded by 7 percentage points over the last five years. This was the most relevant factor (aside from the revenue impact) behind its higher earnings; interest expenses and taxes can also affect EPS but don’t tell us as much about a company’s fundamentals.
Like with revenue, we analyze EPS over a more recent period because it can provide insight into an emerging theme or development for the business.
For Arthur J. Gallagher, its two-year annual EPS growth of 11.1% was lower than its five-year trend. This wasn’t great, but at least the company was successful in other measures of financial health.
In Q3, Arthur J. Gallagher reported adjusted EPS of $2.32, up from $2.26 in the same quarter last year. Despite growing year on year, this print missed analysts’ estimates, but we care more about long-term adjusted EPS growth than short-term movements. Over the next 12 months, Wall Street expects Arthur J. Gallagher’s full-year EPS of $10.45 to grow 24.7%.
Key Takeaways from Arthur J. Gallagher’s Q3 Results
We struggled to find many positives in these results. Its revenue missed and its EPS fell short of Wall Street’s estimates. Overall, this quarter could have been better. The stock remained flat at $258.06 immediately following the results.
Arthur J. Gallagher didn’t show it’s best hand this quarter, but does that create an opportunity to buy the stock right now? What happened in the latest quarter matters, but not as much as longer-term business quality and valuation, when deciding whether to invest in this stock. We cover that in our actionable full research report which you can read here, it’s free for active Edge members.


