
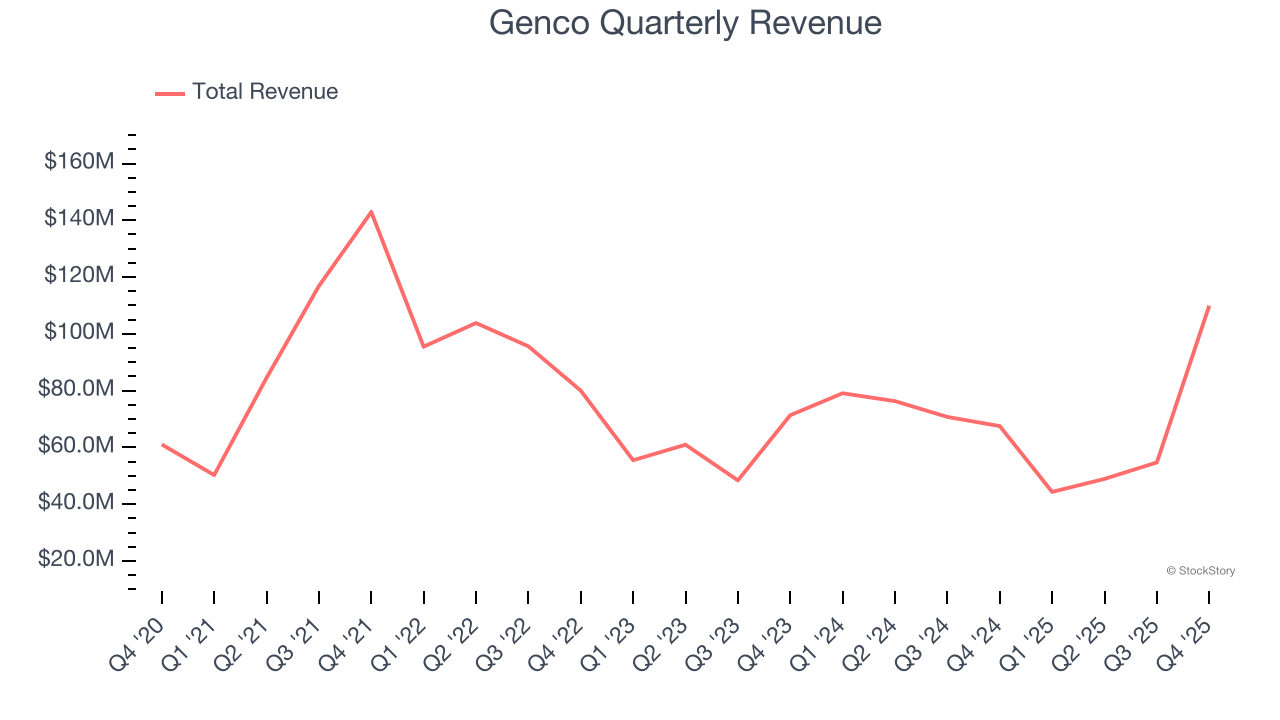
Maritime shipping company Genco (NYSE: GNK) reported Q4 CY2025 results beating Wall Street’s revenue expectations, with sales up 62.8% year on year to $109.9 million. Its non-GAAP profit of $0.39 per share was 5.8% above analysts’ consensus estimates.
Is now the time to buy Genco? Find out by accessing our full research report, it’s free.
Genco (GNK) Q4 CY2025 Highlights:
- Revenue: $109.9 million vs analyst estimates of $77.21 million (62.8% year-on-year growth, 42.4% beat)
- Adjusted EPS: $0.39 vs analyst estimates of $0.37 (5.8% beat)
- Adjusted EBITDA: $41.99 million vs analyst estimates of $40.44 million (38.2% margin, 3.8% beat)
- Operating Margin: 17.3%, down from 21.6% in the same quarter last year
- Free Cash Flow was -$57.62 million compared to -$20.45 million in the same quarter last year
- owned vessels: 43, up 1 year on year
- Market Capitalization: $960.4 million
John C. Wobensmith, Chief Executive Officer, commented, “During 2025, we made notable progress executing our comprehensive value strategy, as we provided shareholders with sizeable returns and invested in our fleet to further expand Genco’s earnings and dividend power. Drawing on our significant cash flow in Q4, we declared a multi-year high dividend of $0.50 per share, which marks the Company’s 26th consecutive dividend and the longest uninterrupted period in our drybulk peer group. Including the Q4 payment, total dividends to shareholders over the past 6.5 years will increase to $7.565 per share, or 34% of our current share price. Complementing this sizeable return of capital, we have continued to take advantage of Genco’s significant financial strength, investing $343 million in high specification Capesize and Newcastlemax vessels since 2023.”
Company Overview
Headquartered in NYC, Genco (NYSE: GNK) is a shipping company that transports dry bulk cargo along worldwide maritime routes.
Revenue Growth
A company’s long-term sales performance is one signal of its overall quality. Any business can have short-term success, but a top-tier one grows for years. Unfortunately, Genco’s 5.6% annualized revenue growth over the last five years was tepid. This was below our standard for the industrials sector and is a tough starting point for our analysis.
We at StockStory place the most emphasis on long-term growth, but within industrials, a half-decade historical view may miss cycles, industry trends, or a company capitalizing on catalysts such as a new contract win or a successful product line. Genco’s recent performance shows its demand has slowed as its annualized revenue growth of 4.5% over the last two years was below its five-year trend. We’re wary when companies in the sector see decelerations in revenue growth, as it could signal changing consumer tastes aided by low switching costs. 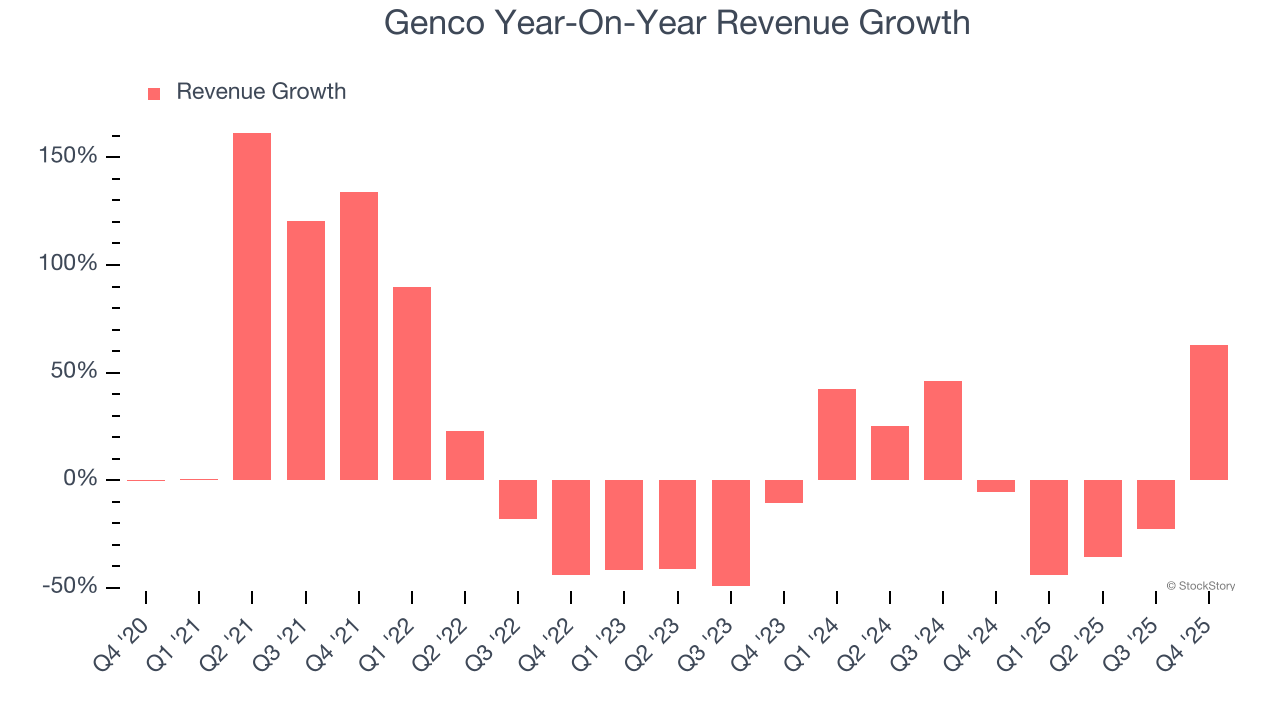
We can dig further into the company’s revenue dynamics by analyzing its number of owned vessels, which reached 43 in the latest quarter. Over the last two years, Genco’s owned vessels averaged 1.7% year-on-year declines. Because this number is lower than its revenue growth during the same period, we can see the company’s monetization has risen. 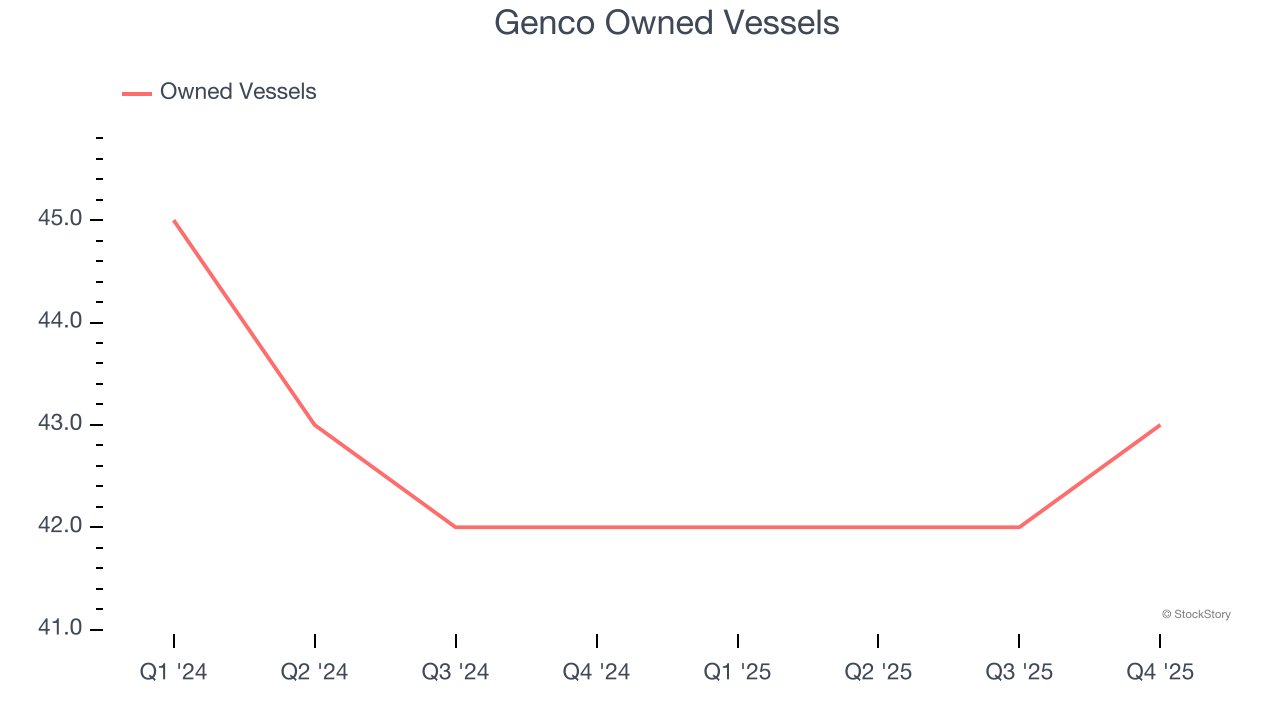
This quarter, Genco reported magnificent year-on-year revenue growth of 62.8%, and its $109.9 million of revenue beat Wall Street’s estimates by 42.4%.
Looking ahead, sell-side analysts expect revenue to grow 16.9% over the next 12 months, an improvement versus the last two years. This projection is eye-popping and suggests its newer products and services will spur better top-line performance.
The 1999 book Gorilla Game predicted Microsoft and Apple would dominate tech before it happened. Its thesis? Identify the platform winners early. Today, enterprise software companies embedding generative AI are becoming the new gorillas. a profitable, fast-growing enterprise software stock that is already riding the automation wave and looking to catch the generative AI next.
Operating Margin
Operating margin is one of the best measures of profitability because it tells us how much money a company takes home after procuring and manufacturing its products, marketing and selling those products, and most importantly, keeping them relevant through research and development.
Genco has been a well-oiled machine over the last five years. It demonstrated elite profitability for an industrials business, boasting an average operating margin of 29.3%. This result was particularly impressive because of its low gross margin, which is mostly a factor of what it sells and takes huge shifts to move meaningfully. Companies have more control over their operating margins, and it’s a show of well-managed operations if they’re high when gross margins are low.
Looking at the trend in its profitability, Genco’s operating margin decreased by 48.1 percentage points over the last five years. This raises questions about the company’s expense base because its revenue growth should have given it leverage on its fixed costs, resulting in better economies of scale and profitability.
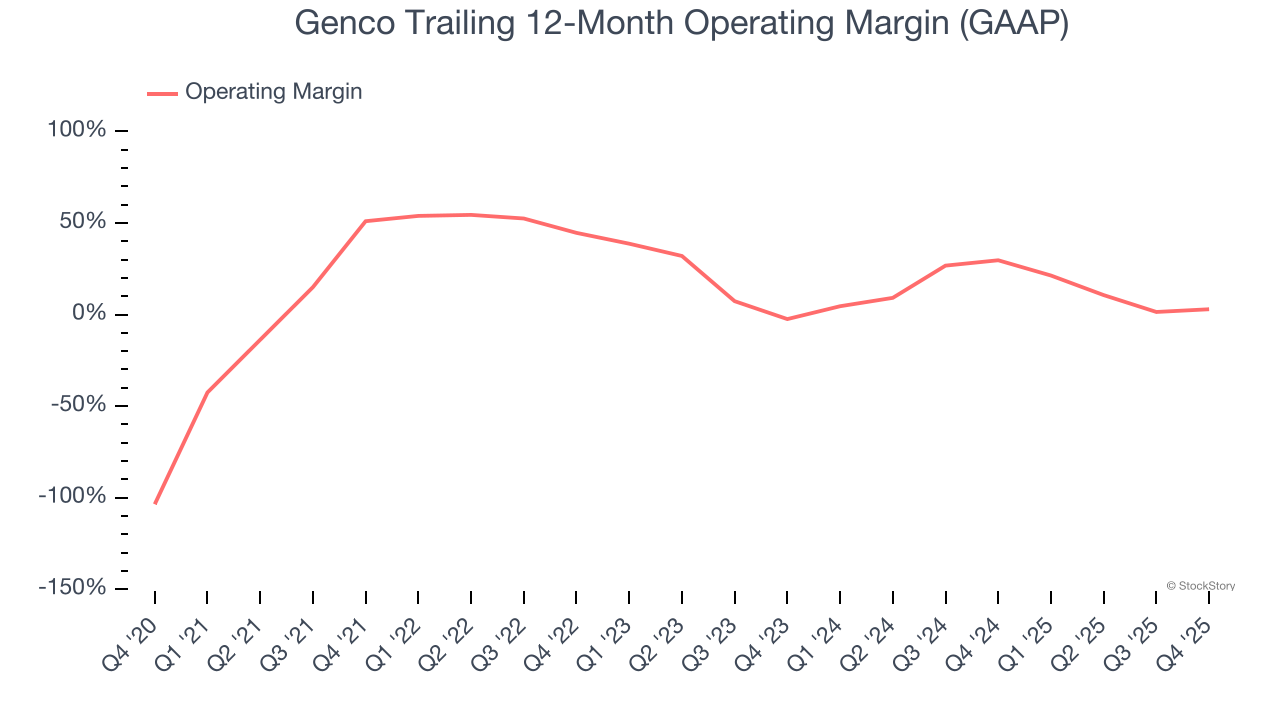
In Q4, Genco generated an operating margin profit margin of 17.3%, down 4.3 percentage points year on year. Conversely, its revenue and gross margin actually rose, so we can assume it was less efficient because its operating expenses like marketing, R&D, and administrative overhead grew faster than its revenue.
Earnings Per Share
Revenue trends explain a company’s historical growth, but the long-term change in earnings per share (EPS) points to the profitability of that growth – for example, a company could inflate its sales through excessive spending on advertising and promotions.
Although Genco’s full-year earnings are still negative, it reduced its losses and improved its EPS by 35.2% annually over the last five years. The next few quarters will be critical for assessing its long-term profitability.
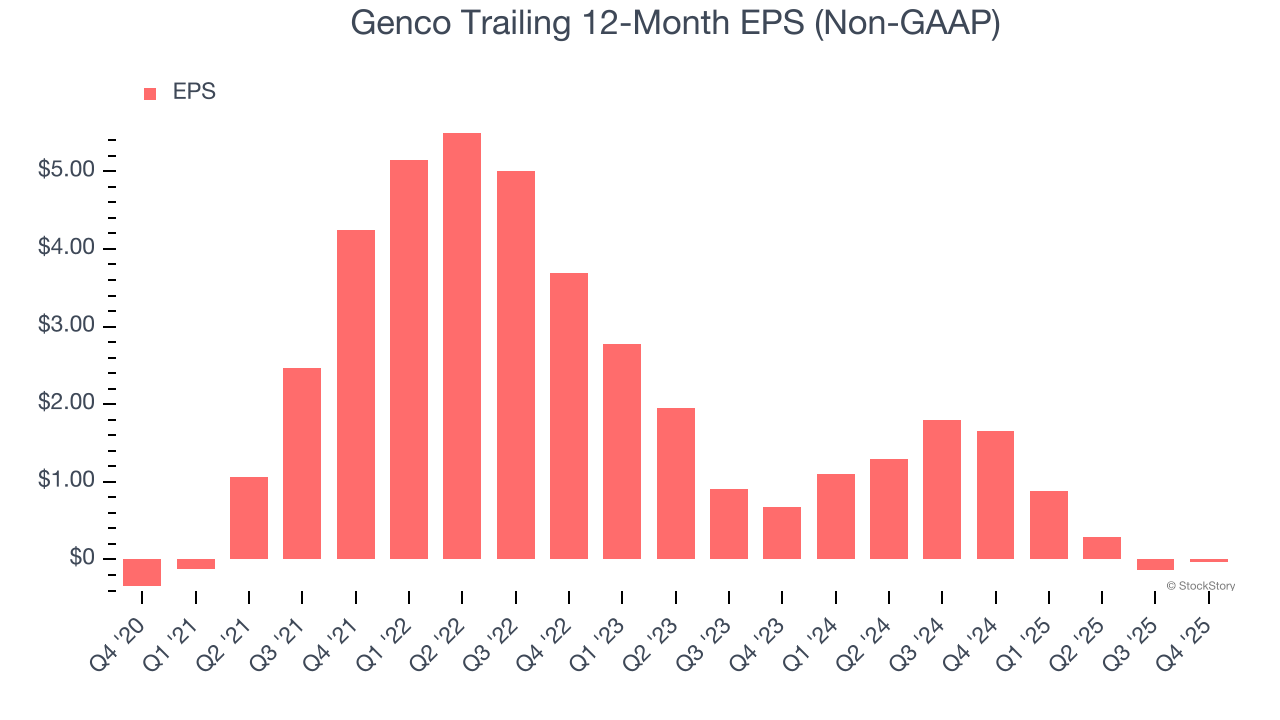
Like with revenue, we analyze EPS over a shorter period to see if we are missing a change in the business.
Sadly for Genco, its EPS declined by 43.5% annually over the last two years while its revenue grew by 4.5%. This tells us the company became less profitable on a per-share basis as it expanded.
Diving into the nuances of Genco’s earnings can give us a better understanding of its performance. A two-year view shows Genco has diluted its shareholders, growing its share count by 2.1%. This dilution overshadowed its increased operational efficiency and has led to lower per share earnings. 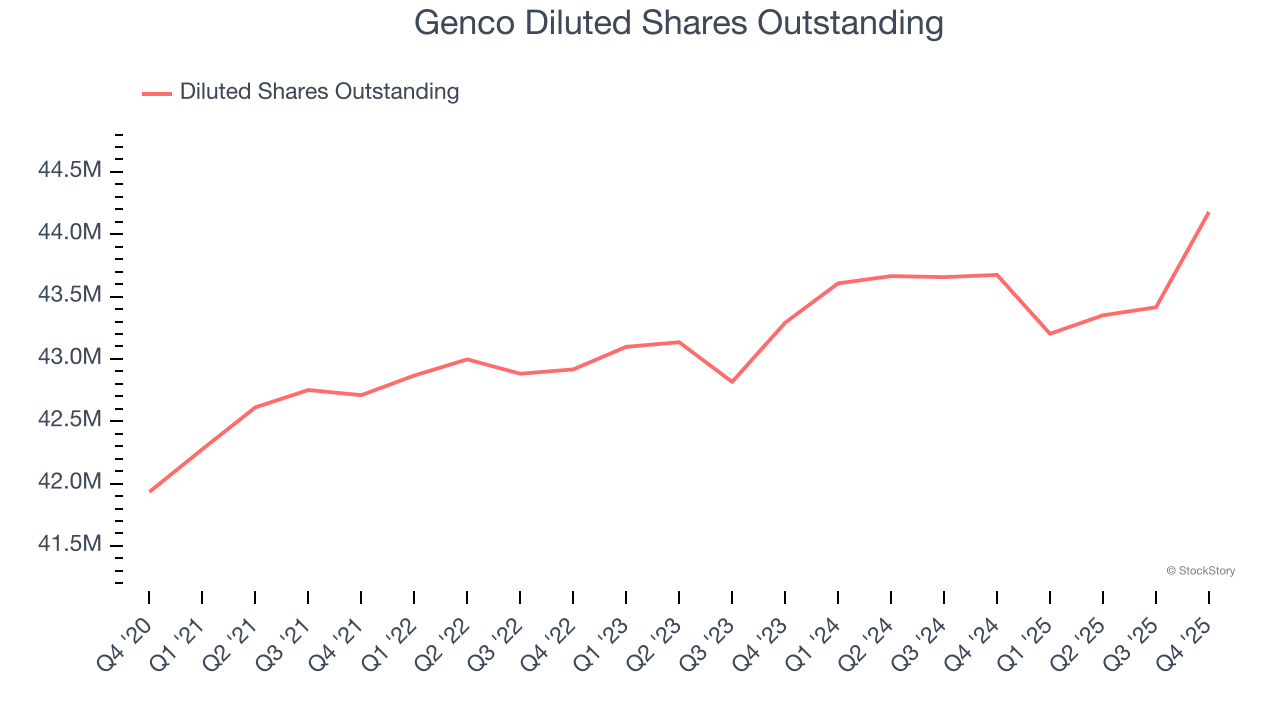
In Q4, Genco reported adjusted EPS of $0.39, up from $0.29 in the same quarter last year. This print beat analysts’ estimates by 5.8%. Over the next 12 months, Wall Street is optimistic. Analysts forecast Genco’s full-year EPS of negative $0.04 will flip to positive $1.40.
Key Takeaways from Genco’s Q4 Results
We were impressed by how significantly Genco blew past analysts’ revenue expectations this quarter. We were also glad its EBITDA outperformed Wall Street’s estimates. Zooming out, we think this quarter featured some important positives. The stock remained flat at $22.35 immediately following the results.
So should you invest in Genco right now? The latest quarter does matter, but not nearly as much as longer-term fundamentals and valuation, when deciding if the stock is a buy. We cover that in our actionable full research report which you can read here (it’s free).


