
Online casino and sports betting company Rush Street Interactive (NYSE: RSI) reported Q4 CY2025 results topping the market’s revenue expectations, with sales up 27.8% year on year to $324.9 million. The company’s full-year revenue guidance of $1.4 billion at the midpoint came in 6.2% above analysts’ estimates. Its non-GAAP profit of $0.08 per share was 24.8% below analysts’ consensus estimates.
Is now the time to buy Rush Street Interactive? Find out by accessing our full research report, it’s free.
Rush Street Interactive (RSI) Q4 CY2025 Highlights:
- Revenue: $324.9 million vs analyst estimates of $304.8 million (27.8% year-on-year growth, 6.6% beat)
- Adjusted EPS: $0.08 vs analyst expectations of $0.11 (24.8% miss)
- Adjusted EBITDA: $44.15 million vs analyst estimates of $42.56 million (13.6% margin, 3.7% beat)
- EBITDA guidance for the upcoming financial year 2026 is $220 million at the midpoint, above analyst estimates of $211.9 million
- Operating Margin: 8.8%, up from 4.8% in the same quarter last year
- Market Capitalization: $1.57 billion
Richard Schwartz, Chief Executive Officer of RSI, said, "We are thrilled to report an extraordinary 2025, delivering record-breaking performance across virtually every key metric. This exceptional performance reflects broad-based strength across all geographies and product verticals, as well as significant growth in our player base. During the fourth quarter, our monthly active users in North American online casino markets grew at the second fastest rate in four and a half years, which again drove outstanding growth in revenues. In addition, quarterly and annual results in Latin America demonstrated remarkable strength and resilience through regulatory headwinds. This broad-based growth drove record profits and demonstrates the powerful operating leverage that we’ve built within our business model.
Company Overview
Specializing in online casino gaming and sports betting, Rush Street Interactive (NYSE: RSI) is an operator of digital gaming platforms.
Revenue Growth
A company’s long-term performance is an indicator of its overall quality. Even a bad business can shine for one or two quarters, but a top-tier one grows for years. Over the last five years, Rush Street Interactive grew its sales at a 32.4% annual rate. Though this growth is acceptable on an absolute basis, we need to see more than just topline growth for the consumer discretionary sector, which can display significant earnings volatility. This means our bar for the sector is particularly high, reflecting the non-essential and hit-driven nature of the products and services offered. Additionally, five-year CAGR starts around Covid, when revenue was depressed then rebounded.
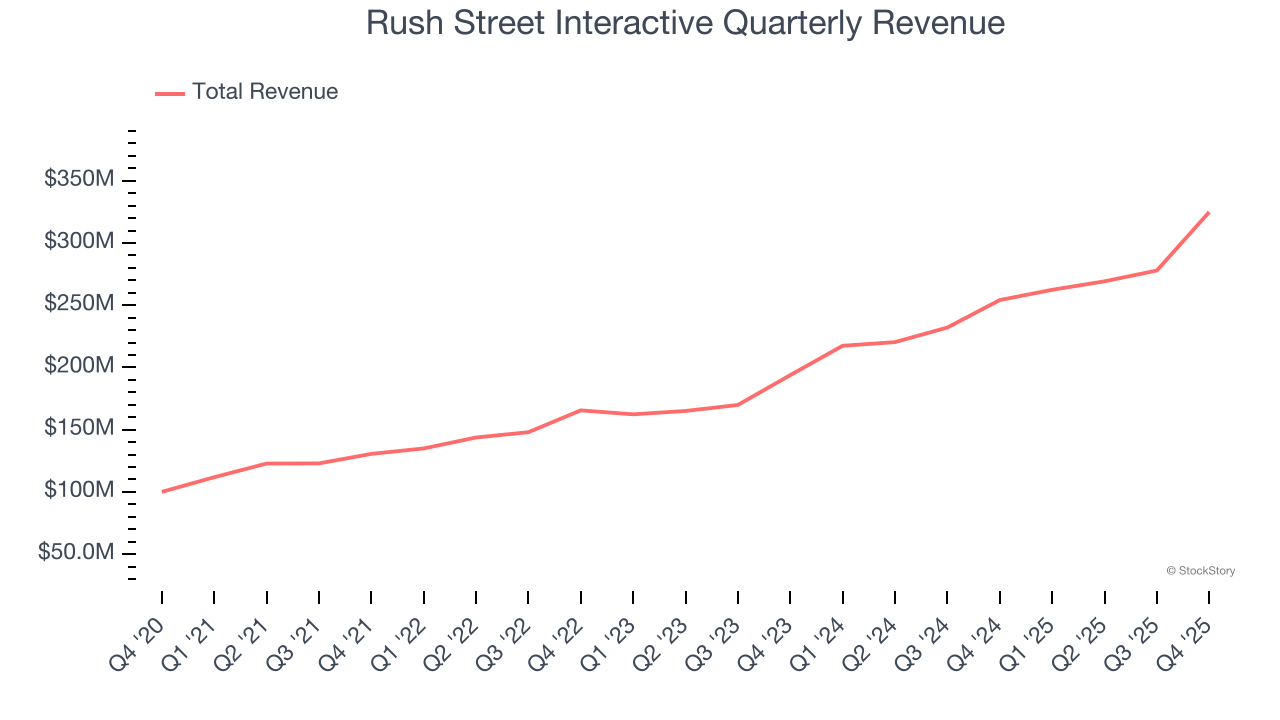
Long-term growth is the most important, but within consumer discretionary, product cycles are short and revenue can be hit-driven due to rapidly changing trends and consumer preferences. Rush Street Interactive’s recent performance shows its demand has slowed as its annualized revenue growth of 28.1% over the last two years was below its five-year trend. We’re wary when companies in the sector see decelerations in revenue growth, as it could signal changing consumer tastes aided by low switching costs. 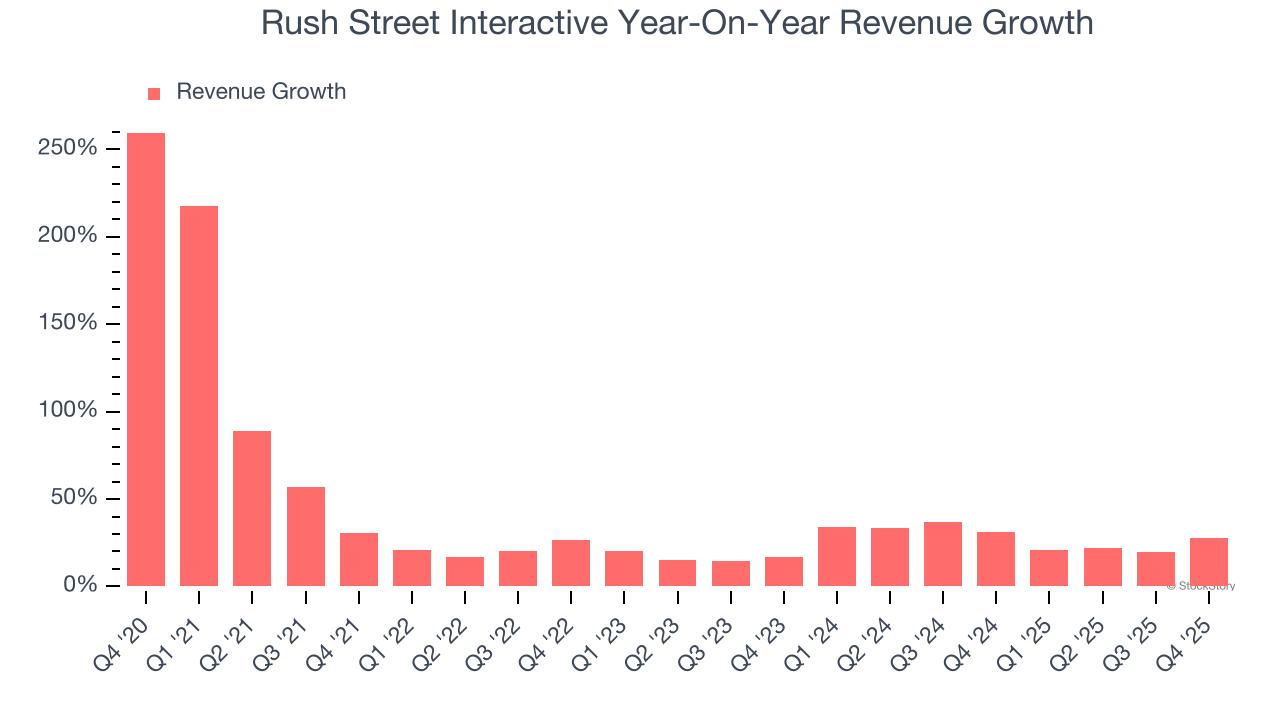
This quarter, Rush Street Interactive reported robust year-on-year revenue growth of 27.8%, and its $324.9 million of revenue topped Wall Street estimates by 6.6%.
Looking ahead, sell-side analysts expect revenue to grow 16.9% over the next 12 months, a deceleration versus the last two years. Despite the slowdown, this projection is noteworthy and suggests the market is forecasting success for its products and services.
While Wall Street chases Nvidia at all-time highs, an under-the-radar semiconductor supplier is dominating a critical AI component these giants can’t build without. Click here to access our free report one of our favorites growth stories.
Operating Margin
Rush Street Interactive’s operating margin has been trending up over the last 12 months and averaged 5.4% over the last two years. The company’s higher efficiency is a breath of fresh air, but its suboptimal cost structure means it still sports inadequate profitability for a consumer discretionary business.
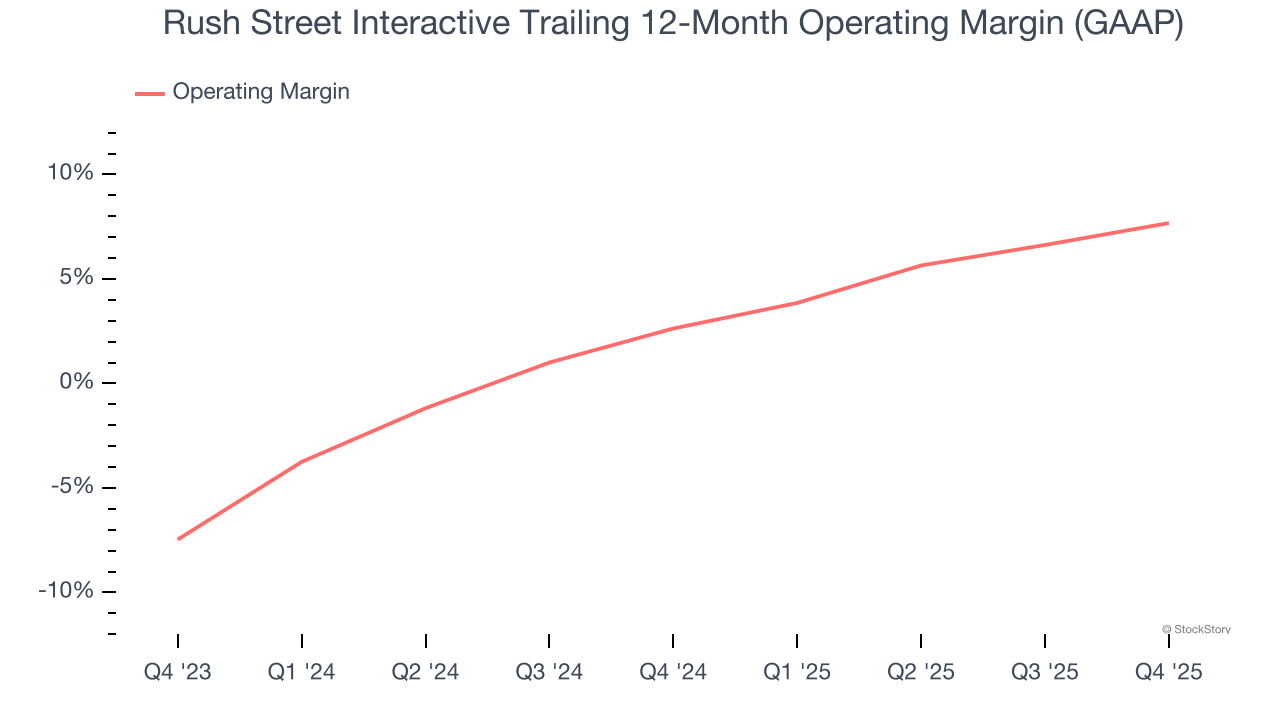
In Q4, Rush Street Interactive generated an operating margin profit margin of 8.8%, up 4.1 percentage points year on year. This increase was a welcome development and shows it was more efficient.
Earnings Per Share
Revenue trends explain a company’s historical growth, but the long-term change in earnings per share (EPS) points to the profitability of that growth – for example, a company could inflate its sales through excessive spending on advertising and promotions.
Rush Street Interactive’s full-year EPS flipped from negative to positive over the last four years. This is encouraging and shows it’s at a critical moment in its life.
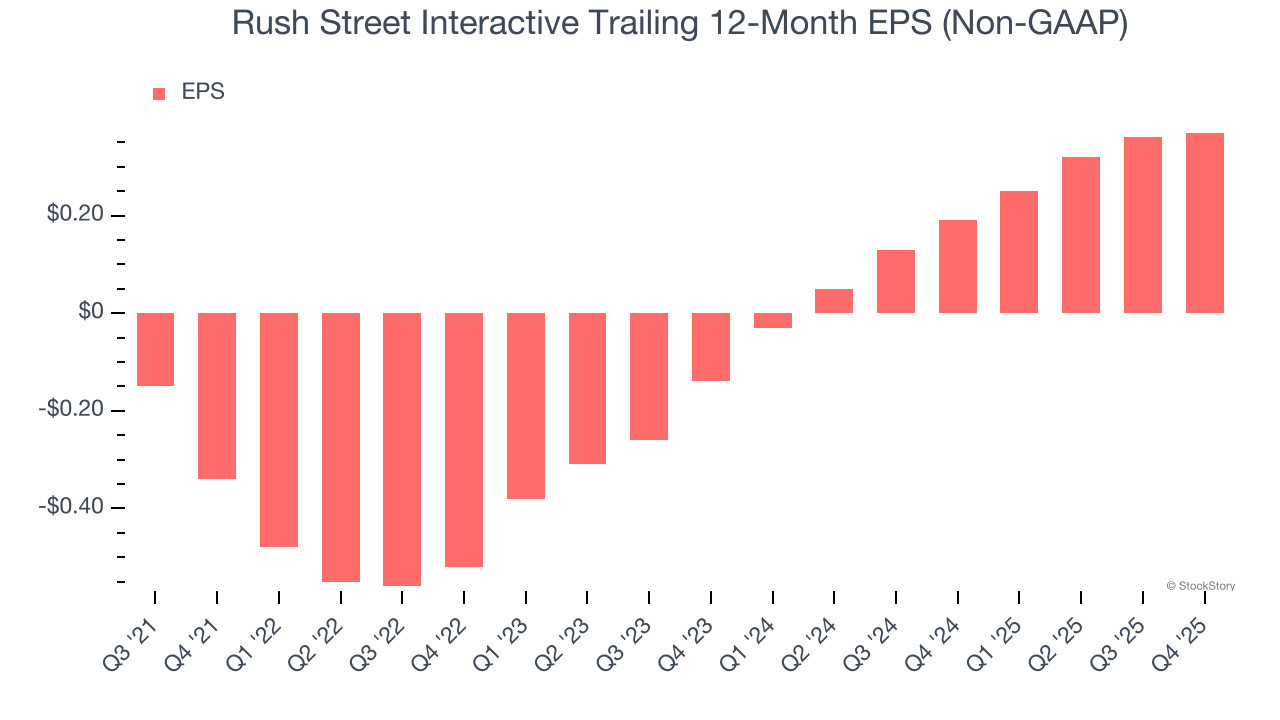
In Q4, Rush Street Interactive reported adjusted EPS of $0.08, up from $0.07 in the same quarter last year. Despite growing year on year, this print missed analysts’ estimates, but we care more about long-term adjusted EPS growth than short-term movements. Over the next 12 months, Wall Street expects Rush Street Interactive’s full-year EPS of $0.37 to grow 57%.
Key Takeaways from Rush Street Interactive’s Q4 Results
We were impressed by Rush Street Interactive’s optimistic full-year revenue guidance, which blew past analysts’ expectations. We were also glad its revenue outperformed Wall Street’s estimates. On the other hand, its EPS missed. Overall, we think this was a decent quarter with some key metrics above expectations. The stock traded up 2.8% to $17.44 immediately following the results.
Indeed, Rush Street Interactive had a rock-solid quarterly earnings result, but is this stock a good investment here? What happened in the latest quarter matters, but not as much as longer-term business quality and valuation, when deciding whether to invest in this stock. We cover that in our actionable full research report which you can read here (it’s free).


