
Environmental and industrial services company Clean Harbors (NYSE: CLH) reported Q4 CY2025 results topping the market’s revenue expectations, with sales up 4.8% year on year to $1.5 billion. Its GAAP profit of $1.62 per share was 0.9% above analysts’ consensus estimates.
Is now the time to buy Clean Harbors? Find out by accessing our full research report, it’s free.
Clean Harbors (CLH) Q4 CY2025 Highlights:
- Revenue: $1.5 billion vs analyst estimates of $1.46 billion (4.8% year-on-year growth, 2.5% beat)
- EPS (GAAP): $1.62 vs analyst estimates of $1.61 (0.9% beat)
- Adjusted EBITDA: $278.7 million vs analyst estimates of $274 million (18.6% margin, 1.7% beat)
- EBITDA guidance for the upcoming financial year 2026 is $1.23 billion at the midpoint, in line with analyst expectations
- Operating Margin: 10.6%, in line with the same quarter last year
- Free Cash Flow Margin: 15.6%, down from 17.3% in the same quarter last year
- Market Capitalization: $14.38 billion
“We concluded 2025 with strong fourth-quarter results, including higher profitability in both of our operating segments,” said Eric Gerstenberg, Co-Chief Executive Officer.
Company Overview
Established in 1980, Clean Harbors (NYSE: CLH) provides environmental and industrial services like hazardous and non-hazardous waste disposal and emergency spill cleanups.
Revenue Growth
Reviewing a company’s long-term sales performance reveals insights into its quality. Any business can put up a good quarter or two, but many enduring ones grow for years. Over the last five years, Clean Harbors grew its sales at an exceptional 13.9% compounded annual growth rate. Its growth beat the average industrials company and shows its offerings resonate with customers.
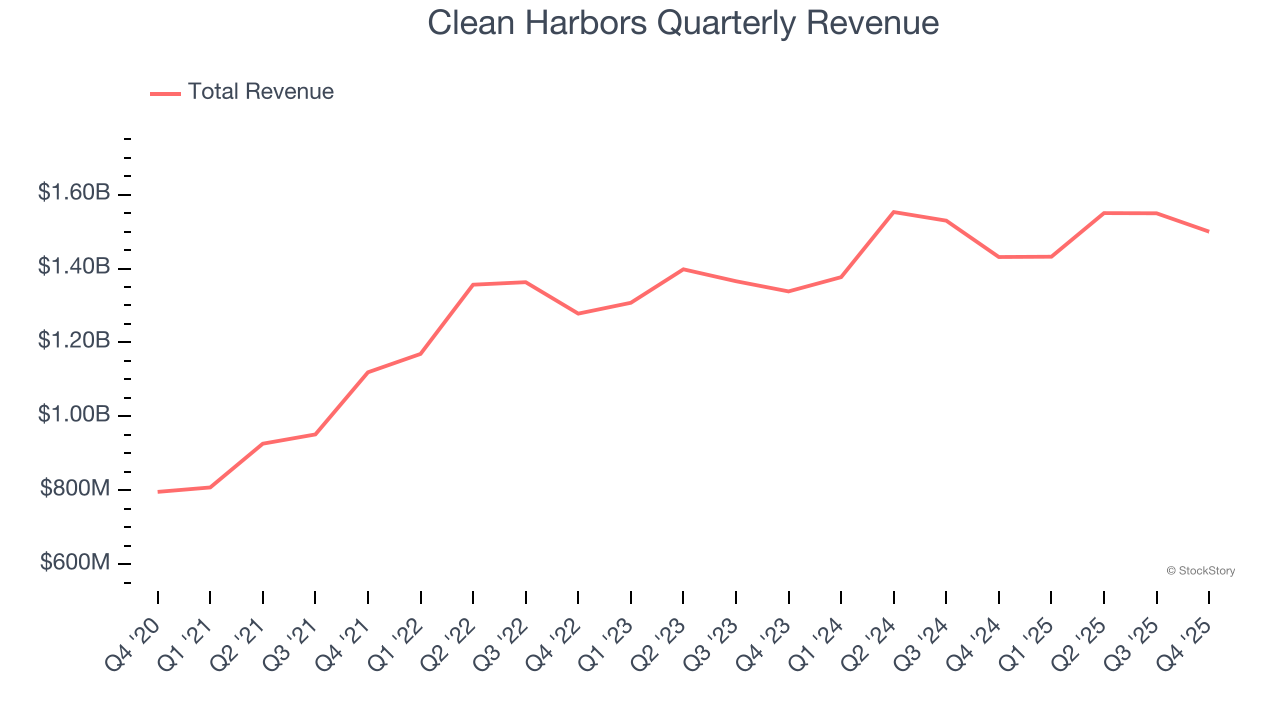
Long-term growth is the most important, but within industrials, a half-decade historical view may miss new industry trends or demand cycles. Clean Harbors’s recent performance shows its demand has slowed significantly as its annualized revenue growth of 5.6% over the last two years was well below its five-year trend. 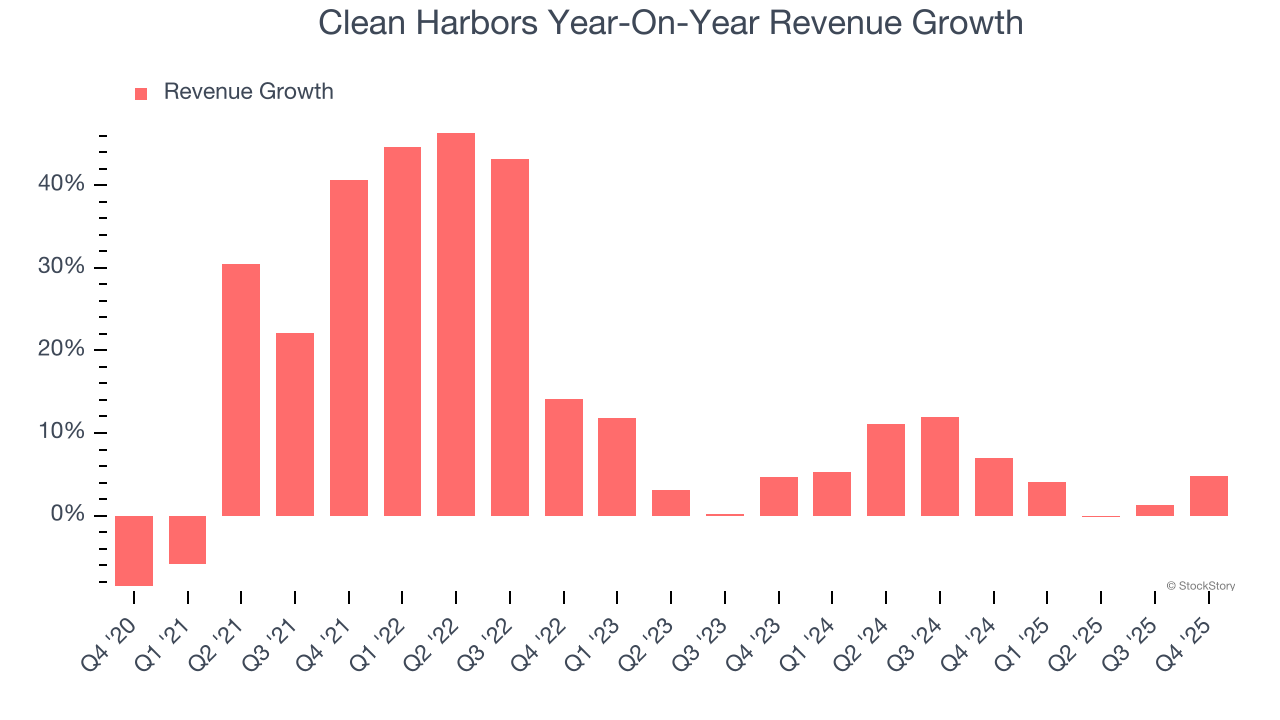
This quarter, Clean Harbors reported modest year-on-year revenue growth of 4.8% but beat Wall Street’s estimates by 2.5%.
Looking ahead, sell-side analysts expect revenue to grow 3.2% over the next 12 months, a slight deceleration versus the last two years. This projection is underwhelming and implies its products and services will face some demand challenges.
While Wall Street chases Nvidia at all-time highs, an under-the-radar semiconductor supplier is dominating a critical AI component these giants can’t build without. Click here to access our free report one of our favorites growth stories.
Operating Margin
Clean Harbors has managed its cost base well over the last five years. It demonstrated solid profitability for an industrials business, producing an average operating margin of 11.2%.
Analyzing the trend in its profitability, Clean Harbors’s operating margin rose by 2 percentage points over the last five years, as its sales growth gave it operating leverage.
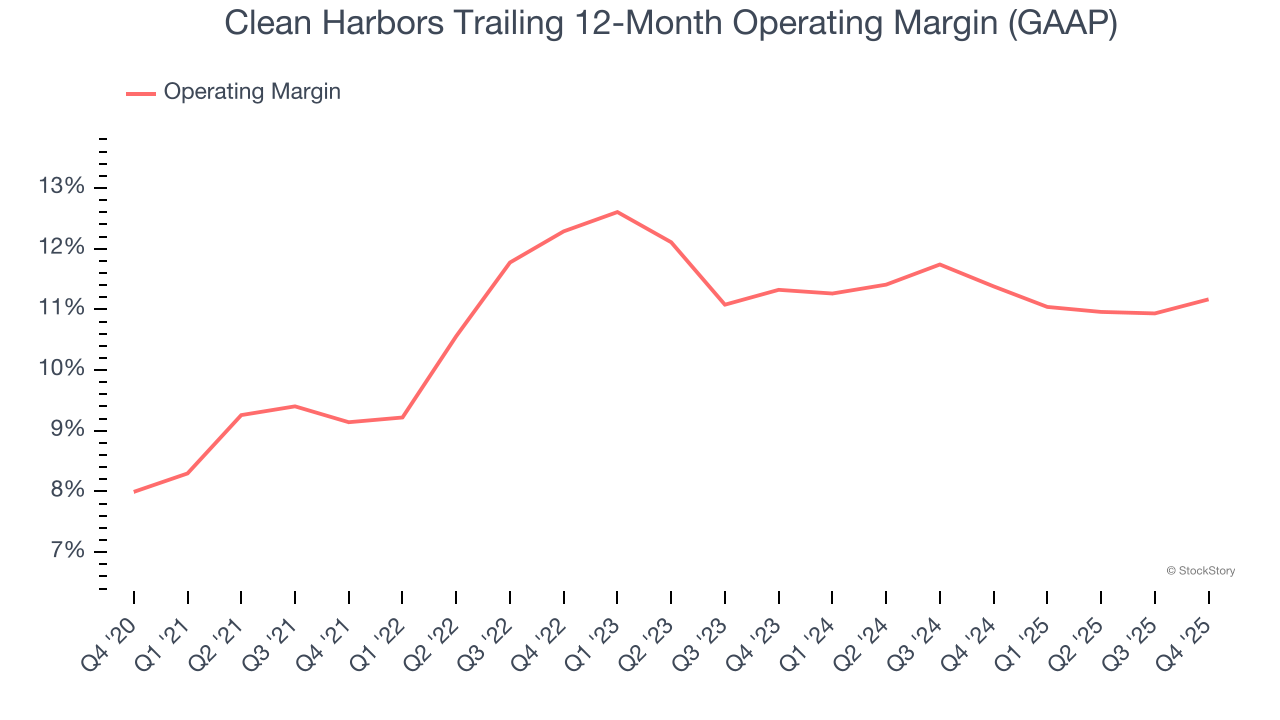
This quarter, Clean Harbors generated an operating margin profit margin of 10.6%, in line with the same quarter last year. This indicates the company’s cost structure has recently been stable.
Earnings Per Share
Revenue trends explain a company’s historical growth, but the long-term change in earnings per share (EPS) points to the profitability of that growth – for example, a company could inflate its sales through excessive spending on advertising and promotions.
Clean Harbors’s EPS grew at an astounding 24.6% compounded annual growth rate over the last five years, higher than its 13.9% annualized revenue growth. This tells us the company became more profitable on a per-share basis as it expanded.
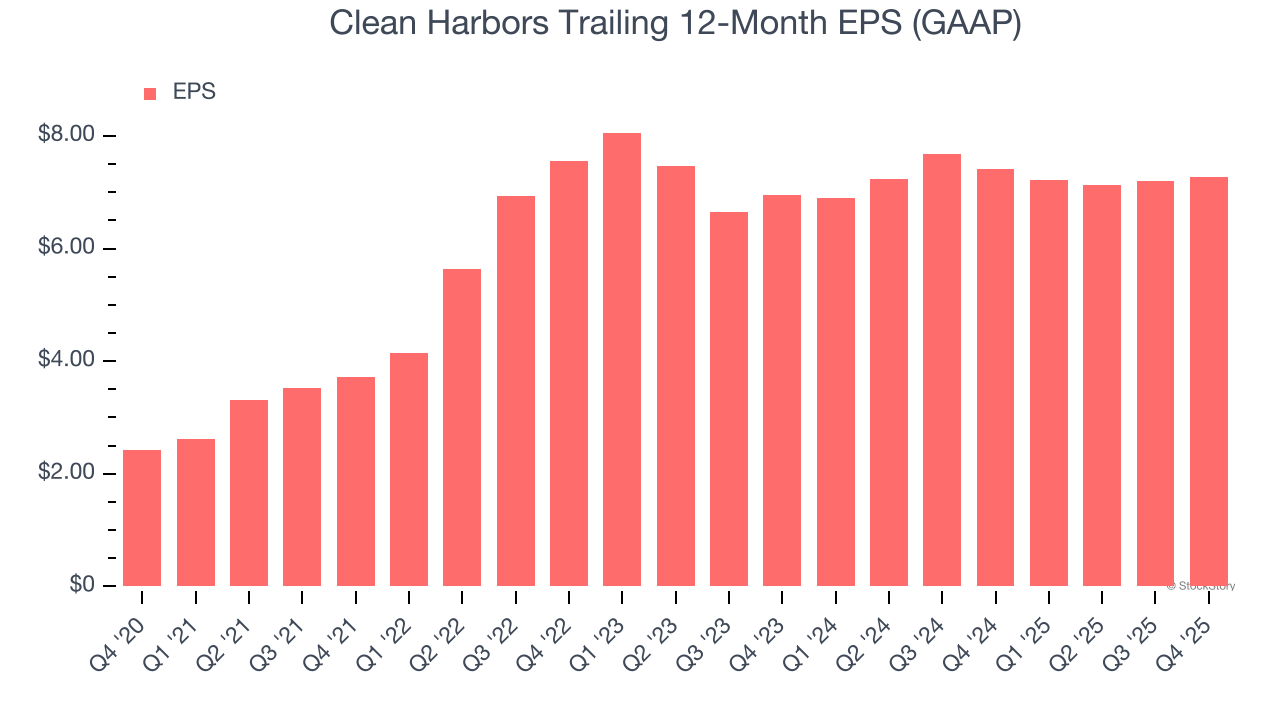
Diving into the nuances of Clean Harbors’s earnings can give us a better understanding of its performance. As we mentioned earlier, Clean Harbors’s operating margin was flat this quarter but expanded by 2 percentage points over the last five years. On top of that, its share count shrank by 3.4%. These are positive signs for shareholders because improving profitability and share buybacks turbocharge EPS growth relative to revenue growth. 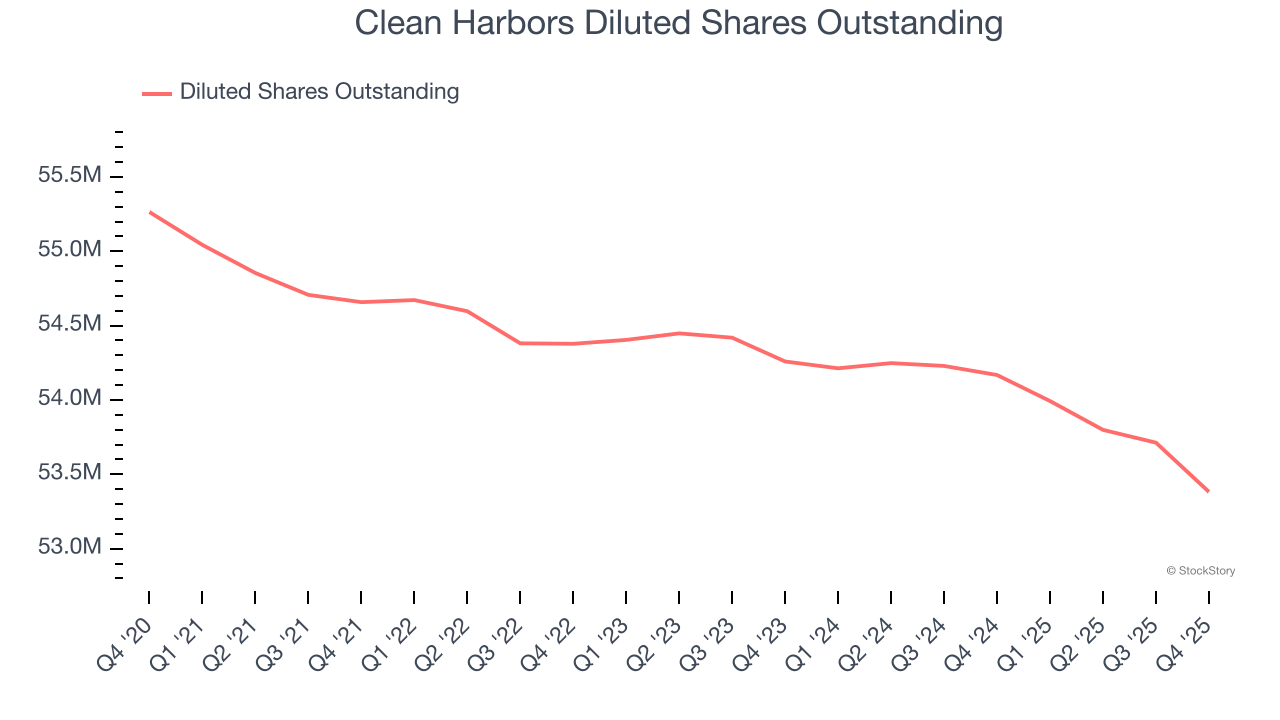
Like with revenue, we analyze EPS over a shorter period to see if we are missing a change in the business.
For Clean Harbors, its two-year annual EPS growth of 2.3% was lower than its five-year trend. We hope its growth can accelerate in the future.
In Q4, Clean Harbors reported EPS of $1.62, up from $1.55 in the same quarter last year. This print was close to analysts’ estimates. Over the next 12 months, Wall Street expects Clean Harbors’s full-year EPS of $7.28 to grow 10.7%.
Key Takeaways from Clean Harbors’s Q4 Results
We enjoyed seeing Clean Harbors beat analysts’ revenue expectations this quarter. We were also happy its EBITDA outperformed Wall Street’s estimates. Overall, this print had some key positives. The stock remained flat at $267.08 immediately following the results.
Is Clean Harbors an attractive investment opportunity at the current price? What happened in the latest quarter matters, but not as much as longer-term business quality and valuation, when deciding whether to invest in this stock. We cover that in our actionable full research report which you can read here (it’s free).


