
Insurance data analytics provider Verisk Analytics (NASDAQ: VRSK) reported revenue ahead of Wall Street’s expectations in Q4 CY2025, with sales up 5.9% year on year to $778.8 million. On the other hand, the company’s full-year revenue guidance of $3.22 billion at the midpoint came in 1.7% below analysts’ estimates. Its non-GAAP profit of $1.82 per share was 12.9% above analysts’ consensus estimates.
Is now the time to buy Verisk? Find out by accessing our full research report, it’s free.
Verisk (VRSK) Q4 CY2025 Highlights:
- Revenue: $778.8 million vs analyst estimates of $773.5 million (5.9% year-on-year growth, 0.7% beat)
- Adjusted EPS: $1.82 vs analyst estimates of $1.61 (12.9% beat)
- Adjusted EBITDA: $437 million vs analyst estimates of $421.4 million (56.1% margin, 3.7% beat)
- Adjusted EPS guidance for the upcoming financial year 2026 is $7.60 at the midpoint, missing analyst estimates by 1.5%
- EBITDA guidance for the upcoming financial year 2026 is $1.81 billion at the midpoint, below analyst estimates of $1.84 billion
- Operating Margin: 40.3%, down from 43% in the same quarter last year
- Free Cash Flow Margin: 35.5%, up from 27.2% in the same quarter last year
- Constant Currency Revenue rose 5.2% year on year (8.6% in the same quarter last year)
- Market Capitalization: $24.71 billion
Company Overview
Processing over 2.8 billion insurance transaction records annually through one of the world's largest private databases, Verisk Analytics (NASDAQ: VRSK) provides data, analytics, and technology solutions that help insurance companies assess risk, detect fraud, and make better business decisions.
Revenue Growth
A company’s long-term sales performance is one signal of its overall quality. Any business can have short-term success, but a top-tier one grows for years.
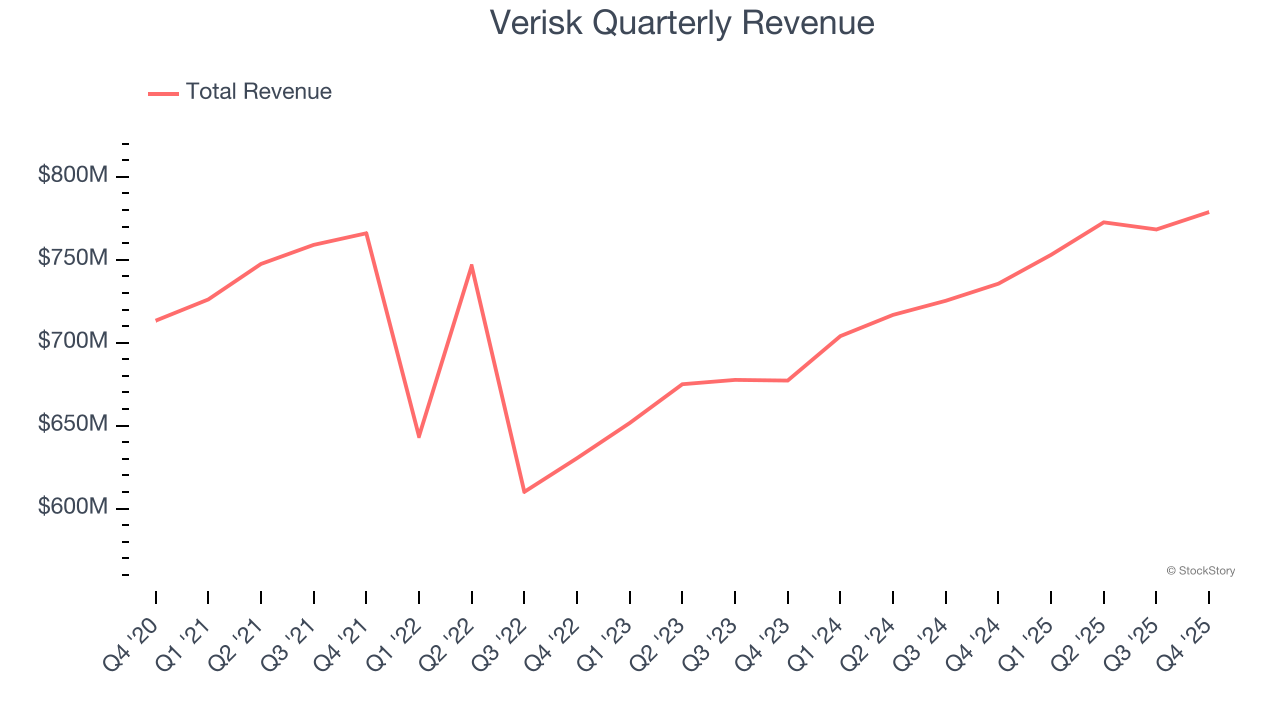
With $3.07 billion in revenue over the past 12 months, Verisk is a mid-sized business services company, which sometimes brings disadvantages compared to larger competitors benefiting from better economies of scale.
As you can see below, Verisk’s sales grew at a sluggish 2% compounded annual growth rate over the last five years. This shows it failed to generate demand in any major way and is a rough starting point for our analysis.
Long-term growth is the most important, but within business services, a half-decade historical view may miss new innovations or demand cycles. Verisk’s annualized revenue growth of 7% over the last two years is above its five-year trend, suggesting its demand recently accelerated. 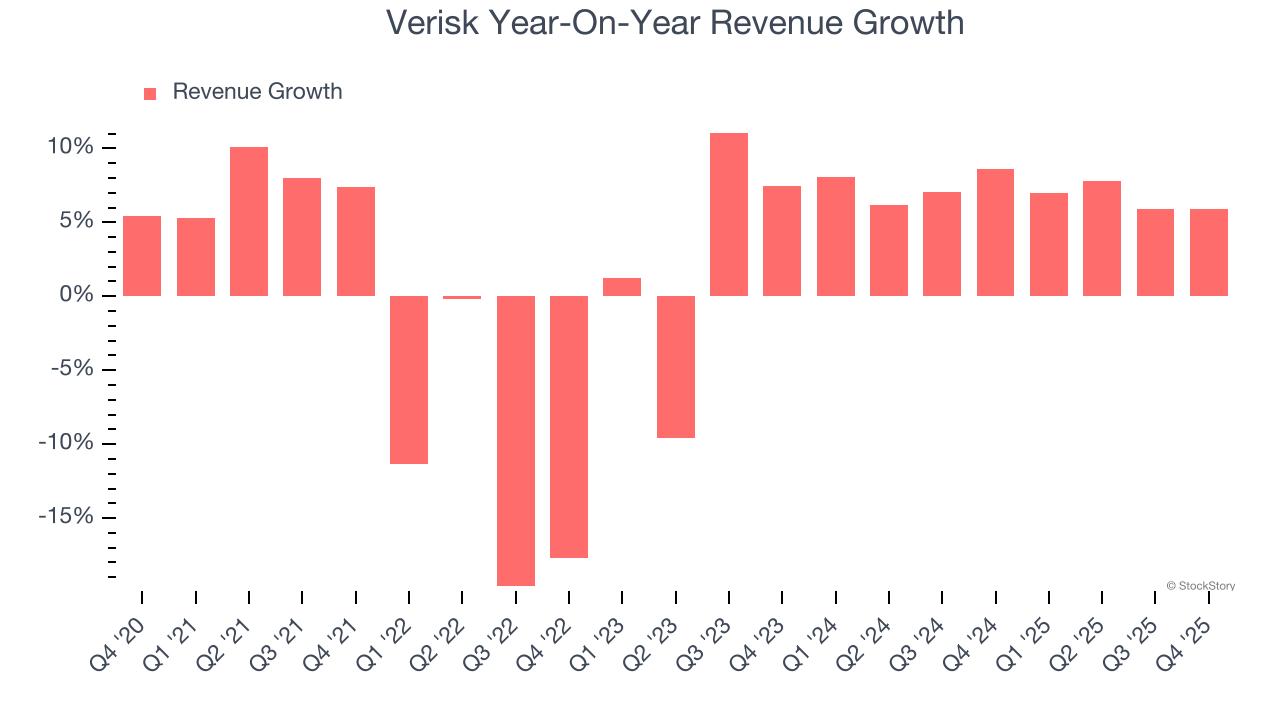
Verisk also reports sales performance excluding currency movements, which are outside the company’s control and not indicative of demand. Over the last two years, its constant currency sales averaged 6.9% year-on-year growth. Because this number aligns with its normal revenue growth, we can see that Verisk has properly hedged its foreign currency exposure. 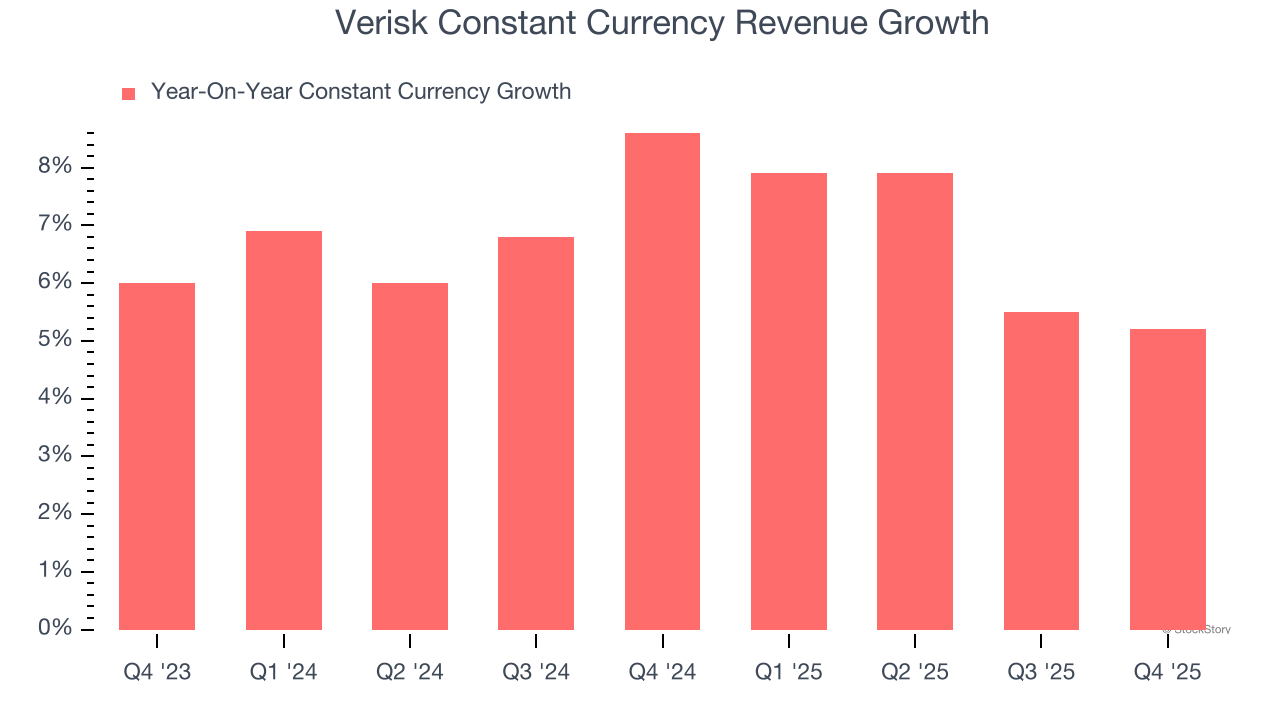
This quarter, Verisk reported year-on-year revenue growth of 5.9%, and its $778.8 million of revenue exceeded Wall Street’s estimates by 0.7%.
Looking ahead, sell-side analysts expect revenue to grow 6.1% over the next 12 months, similar to its two-year rate. This projection is above the sector average and implies its newer products and services will help sustain its recent top-line performance.
While Wall Street chases Nvidia at all-time highs, an under-the-radar semiconductor supplier is dominating a critical AI component these giants can’t build without. Click here to access our free report one of our favorites growth stories.
Operating Margin
Operating margin is an important measure of profitability as it shows the portion of revenue left after accounting for all core expenses – everything from the cost of goods sold to advertising and wages. It’s also useful for comparing profitability across companies with different levels of debt and tax rates because it excludes interest and taxes.
Verisk has been a well-oiled machine over the last five years. It demonstrated elite profitability for a business services business, boasting an average operating margin of 43.5%.
Analyzing the trend in its profitability, Verisk’s operating margin rose by 10.4 percentage points over the last five years, as its sales growth gave it operating leverage.
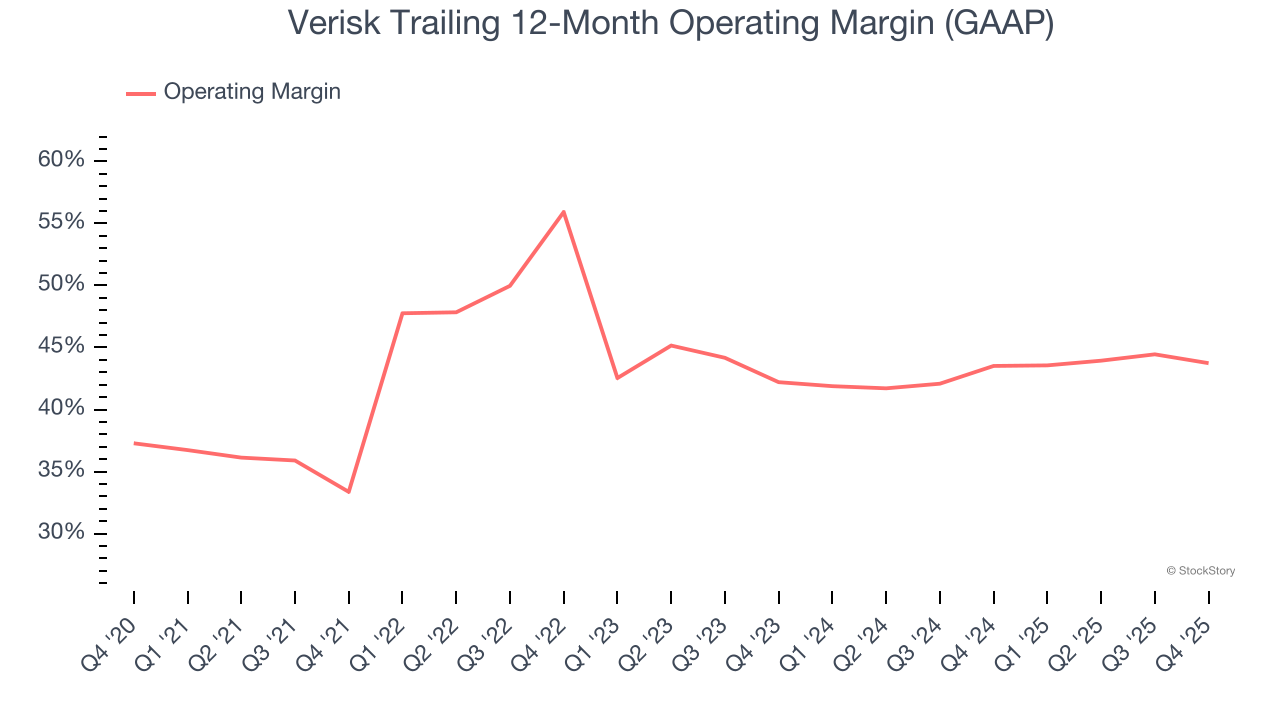
This quarter, Verisk generated an operating margin profit margin of 40.3%, down 2.7 percentage points year on year. This contraction shows it was less efficient because its expenses grew faster than its revenue.
Earnings Per Share
Revenue trends explain a company’s historical growth, but the long-term change in earnings per share (EPS) points to the profitability of that growth – for example, a company could inflate its sales through excessive spending on advertising and promotions.
Verisk’s EPS grew at an unimpressive 7.2% compounded annual growth rate over the last five years. On the bright side, this performance was better than its 2% annualized revenue growth and tells us the company became more profitable on a per-share basis as it expanded.
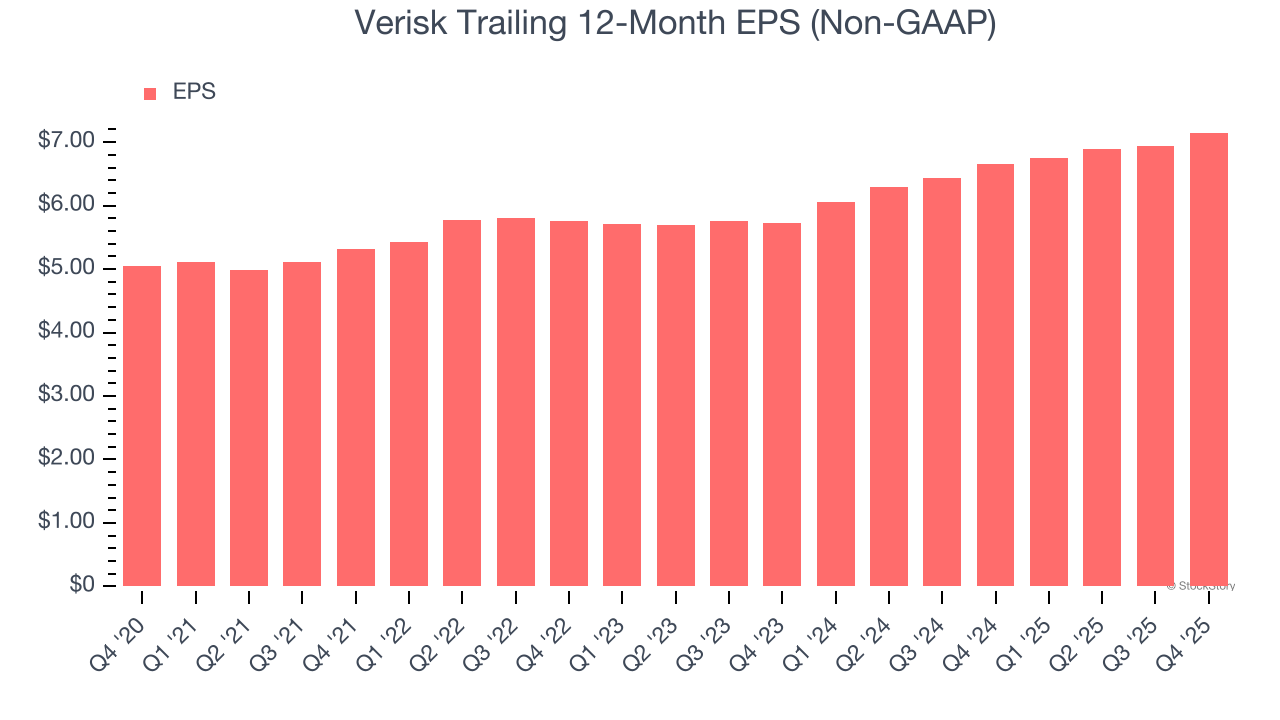
Diving into the nuances of Verisk’s earnings can give us a better understanding of its performance. As we mentioned earlier, Verisk’s operating margin declined this quarter but expanded by 10.4 percentage points over the last five years. Its share count also shrank by 15.5%, and these factors together are positive signs for shareholders because improving profitability and share buybacks turbocharge EPS growth relative to revenue growth. 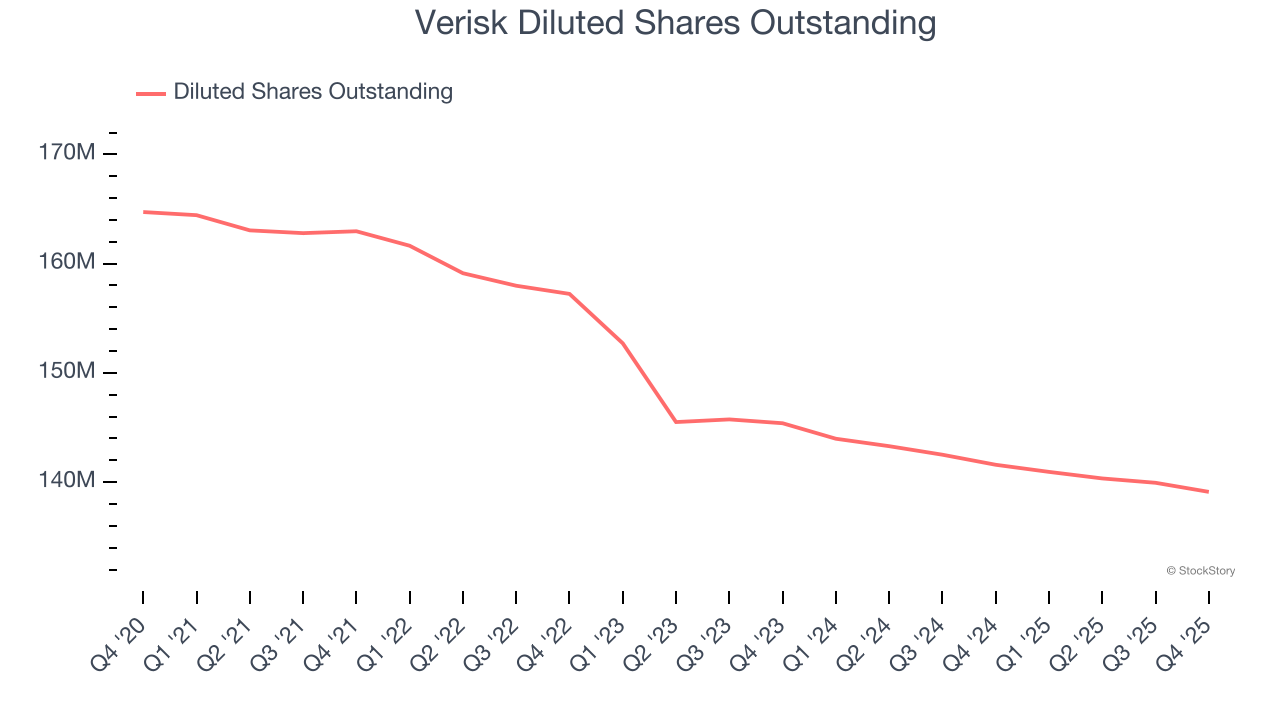
Like with revenue, we analyze EPS over a shorter period to see if we are missing a change in the business.
For Verisk, its two-year annual EPS growth of 11.8% was higher than its five-year trend. Accelerating earnings growth is almost always an encouraging data point.
In Q4, Verisk reported adjusted EPS of $1.82, up from $1.61 in the same quarter last year. This print easily cleared analysts’ estimates, and shareholders should be content with the results. Over the next 12 months, Wall Street expects Verisk’s full-year EPS of $7.15 to grow 7.6%.
Key Takeaways from Verisk’s Q4 Results
It was good to see Verisk beat analysts’ EPS expectations this quarter. We were also happy its revenue narrowly outperformed Wall Street’s estimates. On the other hand, its full-year revenue guidance missed and its full-year EPS guidance fell short of Wall Street’s estimates. Overall, this quarter could have been better. The stock traded up 9.1% to $193.37 immediately following the results.
Should you buy the stock or not? If you’re making that decision, you should consider the bigger picture of valuation, business qualities, as well as the latest earnings. We cover that in our actionable full research report which you can read here (it’s free).


