 ( click to enlarge )
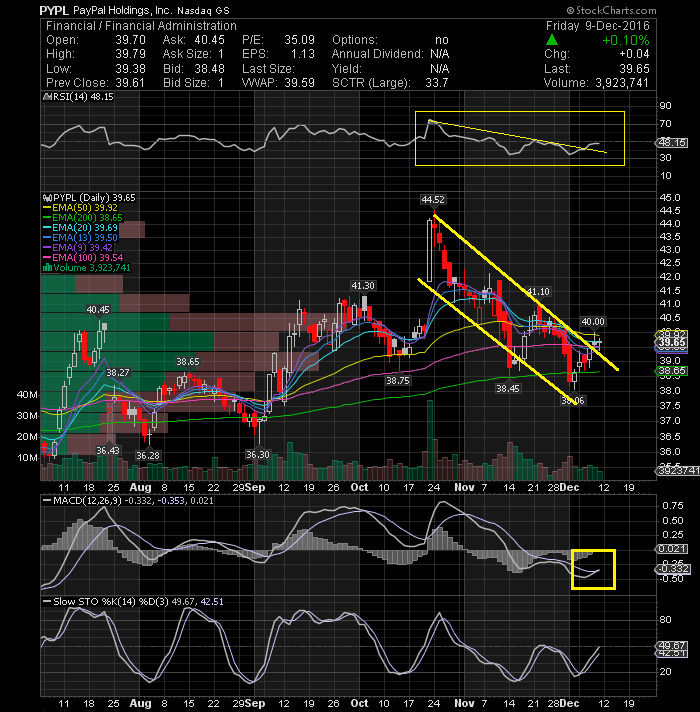
Shares of Paypal Holdings Inc (NASDAQ:PYPL) have witnessed a price breakout on daily chart from the downward sloping trend line. The stock needs now to break and close above the 39.92 level, the declining EMA50, to confirm further upside move and the continuation of the bullish outlook. Also indicators are starting to turn up or positive. MACD has flashed a buy signal, while the RSI is indicating a break from the downward sloping trendline, which adds to the current bullish view. Based on the explanations above, i prefer to long the stock above 40 targeting 41.2 level and 42. Stop loss below 38.65
 ( click to enlarge )
Last week, the stock price finally broke and closed above the important resistance zone around 112. AAPL should have more upside from here, as long as the market does not put any downside pressure on it. Daily technical indicators are looking bullish. The MACD is rising above its signal line and is about to enter positive territory, while RSI continues to rise within bullish territory above 50 line. The Bulls seems to be in control.
 ( click to enlarge )
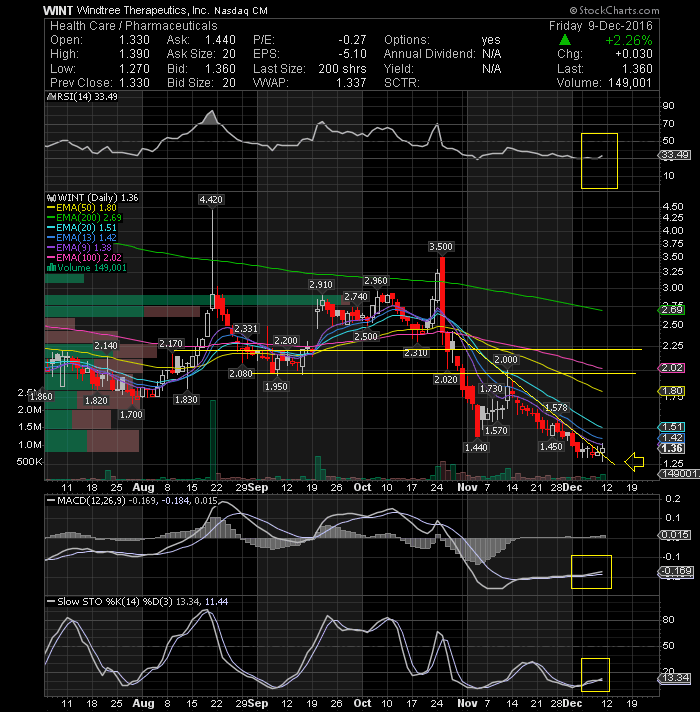
Opexa Therapeutics Inc (NASDAQ:OPXA) ended the week with a bang on Friday. The stock exploded from a low of 91c to a high of $1.48 for a nice intraday move of 60% and traded a record-breaking volume of $10.2 Million. Congratulations to all my readers and twitter followers that played Thursday's alert and pocketed some nice gains. For those of you that will be celebrating this weekend, I would like to present this chart of another low float stock that could see a nice bounce in the week ahead. Windtree Therapeutics Inc (NASDAQ:WINT) has given a trend line breakout on daily on closing basis, which confirms the bull trend in the short-term heading for immediate target of 2.02-2.17 levels. Oscillators like Slow Sto, MACD and RSI too supports bullish momentum.
 ( click to enlarge )
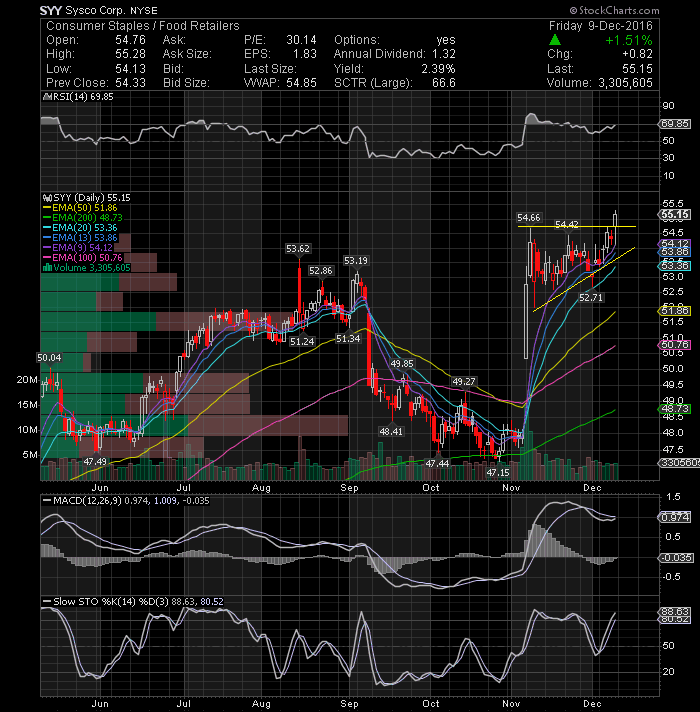
SYSCO Corporation (NYSE:SYY) hit a new 52-week high Friday, trading as high as $55.28, before settling at a close of $55.15. The stock broke a bullish flag formation and will be watching it on Monday, looking for a follow through move. As long as the stock stays above the rising EMA20, the bullish scenario still intact. Technical chart shows very strong bullish sign.
 ( click to enlarge )
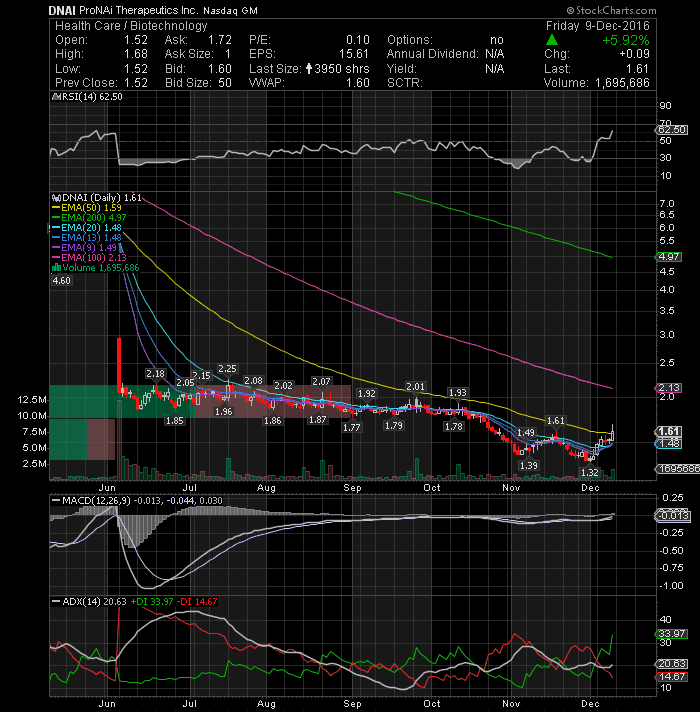
ProNAi Therapeutics Inc (NASDAQ:DNAI) Friday's candle closed back above the EMA50 for the first time in months on above average volume and I expect to see a continuation move next week. The daily technical indicators are reversing up and are advocating for a technical rebound.
 ( click to enlarge )
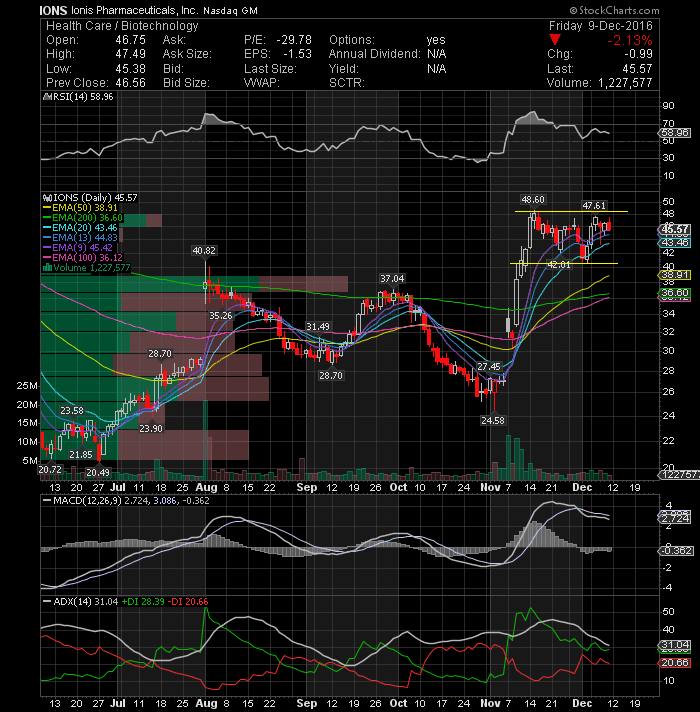
Ionis Pharmaceuticals Inc (NASDAQ:IONS) has been in a beautiful uptrend move since beginning of November. Considering the strong momentum in the past weeks the stock price looks set to break higher and rise above the recent high of 48.60. On watch. Use the $40 level as a stop-loss.
 ( click to enlarge )
Kroger Co (NYSE:KR) share price continues to show lot of strength. Over $34.95 would be buy trigger.
If you want to contact me for advertising opportunities on blog or twitter, then get in touch via email
Disclaimer : This is not an investment advisory, and should not be used to make investment decisions. Information in AC Investor Blog is often opinionated and should be considered for information purposes only. No stock exchange anywhere has approved or disapproved of the information contained herein. There is no express or implied solicitation to buy or sell securities. The charts provided here are not meant for investment purposes and only serve as technical examples. Don't consider buying or selling any stock without conducting your own due diligence.
Thanks for visiting AC Investor Blog.
AC
