When looking at the charts, I spotted a horizontal channel forming in MSC Industrial Direct Co. (MSM) since the end of May. MSM distributes metalworking and maintenance, repair, and operations products in the United States, Canada, Mexico, and the United Kingdom.
A horizontal channel occurs when an asset’s, in this case a stock, price is ranging within a sideways support and resistance zone.
Channels are used by technical analysts to identify areas where breakout trades could form. A breakout is when the price of an asset moves above a resistance level or below a support level. A breakout to the upside signals traders to buy the asset or cover short positions, while a breakout to the downside signals traders to get short or sell long positions.
Let’s take a look at the 1-year chart of MSM with added notations:
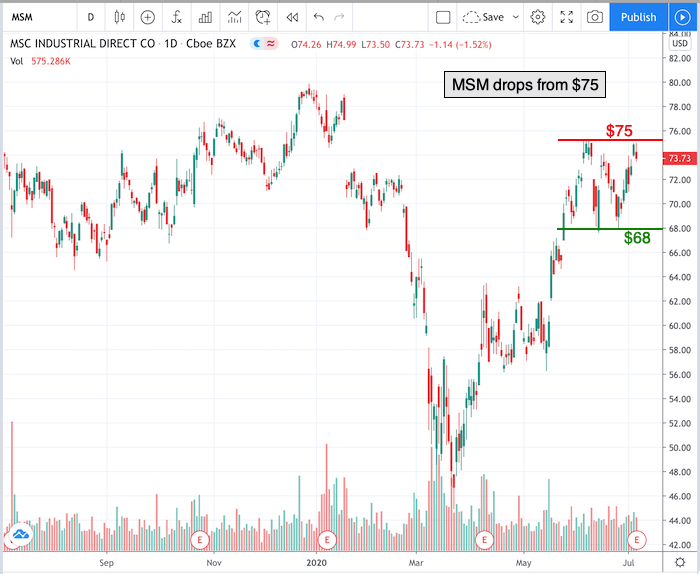
Chart of MSM provided by TradingView
After hitting its low in March, MSM rallied above $68 in late May. Since then, the stock has been fluctuating within a range. A support level has formed at $68 (green) and a resistance level at $75 (red).
As I’m writing this article, MSM is trading about $70, which is within the horizontal channel.
There are two possible trades I am waiting patiently for:
- The stock moves higher, over the $75 resistance level. If/when that happens, a breakout to the upside could occur.
- The stock moves lower, under the $68 support level. If/when that happens, a breakout to the downside could occur.
I will be keeping a close eye on MSM today because this morning it released its quarterly earnings report. MSM reported earnings of $1.40 per share, compared to earnings of $1.45 per share a year ago. The company posted revenues of $834.97 million for the quarter ended May 2020.
Have a good trading day!
Christian Tharp, CMT
@cmtstockcoach
Stock Trading & Investing for Everyone
Want More Great Investing Ideas?
9 “BUY THE DIP” Growth Stocks for 2020
Is the Bull S#*t Rally FINALLY Over?
7 “Safe-Haven” Dividend Stocks for Turbulent Times
Top 3 Investing Strategies for 2020
MSM shares were trading at $69.63 per share on Wednesday morning, down $4.10 (-5.56%). Year-to-date, MSM has declined -2.88%, versus a -0.88% rise in the benchmark S&P 500 index during the same period.
About the Author: Christian Tharp

Christian is an expert stock market coach at the Adam Mesh Trading Group who has mentored more than 4,000 traders and investors. He is a professional technical analyst that is a certified Chartered Market Technician (CMT), which is a designation awarded by the CMT Association. Christian is also the author of the daily online newsletter Todays Big Stock.
The post Chart of the Day: MSC Industrial Direct (MSM) appeared first on StockNews.com