Since NXP Semiconductors (NXPI) bottomed on March 23rd of this year, it has been steadily rising and has formed a trendline.
NXPI is a leading supplier of high-performance mixed-signal products which includes self-driving and sensor equipment used in certain automobiles. NXPI also provides mobile and communications infrastructure for the Internet of Things (IOT).
The company recently reported first-quarter revenue of $2 billion. The company should benefit from the rollout of 5G networks and the adoption of mobile payments in 2020. And last week, KeyBanc raised its price target for NXPI from $120 to $130.
In the past few months, tech stocks have shown impressive strength. The Nasdaq, the tech-heavy index, is actually not only at 52-week highs but also trading at all-time highs.
So it’s not surprising that NXPI has doubled in price since hitting its 52 week low just a few months ago.
As you can see in the chart below, NXPI has formed a clear trendline of support (blue) as shares have been rising.
Take a look at the 1-year chart of NXPI below with my added notations:
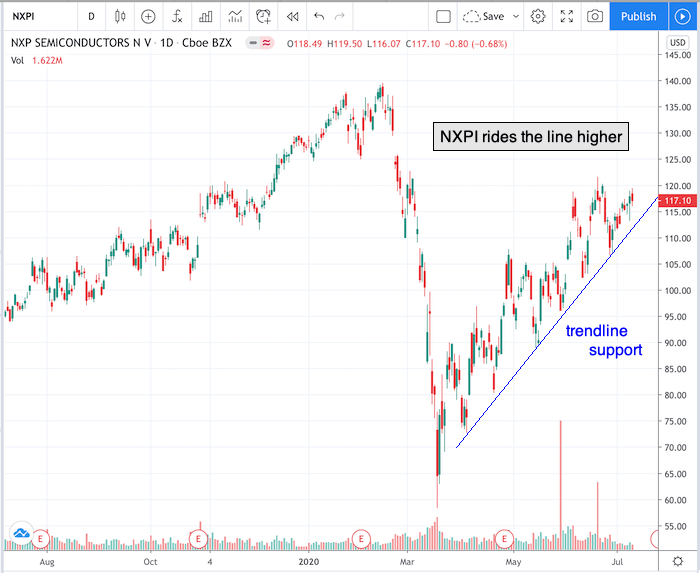
Chart of NXPI provided by TradingView
Any 2 points can start a trend line but the more times the stock tests the trendline, the more relevant it becomes. In this case NXPI has traded near or at it’s trend line 6 times.
There are 2 ways to use a trendline to trade. The first is “buy the dip.” If you think the stock is strong and it has a pullback, you could buy the stock near the trendline. In this scenario, we believe there is a good chance the stock will bounce off the trendline and you’ll see a profitable trade.
The second way to make a trade using a trendline of support, is to wait patiently for the stock to break it’s trendline support to the downside. If/when it does, initiate a short position with the assumption that there will be a breakdown.
Have a good trading day!
Good luck!
Christian Tharp, CMT
@cmtstockcoach
Stock Trading & Investing for Everyone
Want More Great Investing Ideas?
9 “BUY THE DIP” Growth Stocks for 2020
Top 5 WINNING Stock Chart Patterns
7 “Safe-Haven” Dividend Stocks for Turbulent Times
shares were trading at $320.30 per share on Monday morning, up $2.71 (+0.85%). Year-to-date, has gained 0.54%, versus a % rise in the benchmark S&P 500 index during the same period.
About the Author: Christian Tharp

Christian is an expert stock market coach at the Adam Mesh Trading Group who has mentored more than 4,000 traders and investors. He is a professional technical analyst that is a certified Chartered Market Technician (CMT), which is a designation awarded by the CMT Association. Christian is also the author of the daily online newsletter Todays Big Stock.
The post Chart of the Day: NXP Semiconductors (NXPI) appeared first on StockNews.com