APA Corp. (APA) is one of the world's leading independent energy companies engaged in the exploration, development and production of natural gas, crude oil and natural gas liquids. The company’s operations are in the United States, Egypt and in the North Sea of the United Kingdom.
The company’s increasing focus on the Permian basin, which is known for its high internal rates of return, has been a huge growth driver. Its slew of discoveries in offshore Suriname, through its joint venture with TotalEnergies, is another strong growth catalyst for the company and is expected to provide significant cash flow potential.
APA had $538 million in cash as of the end of the latest quarter, compared with only $2 million in short-term debt. Its gross margin of 26.8% is also above the industry average. While growth has been negative due to the pandemic, analysts forecast earnings to rise 506.2% year over year in the current quarter.
The stock also appears undervalued based on its forward P/E of 6.6. However, its trailing P/E is quite high at 954. The stock had been trending up since October, but has since shown mixed performance since March as evident from the chart below.
Take a look at the 1-year chart of APA below with my added notations:
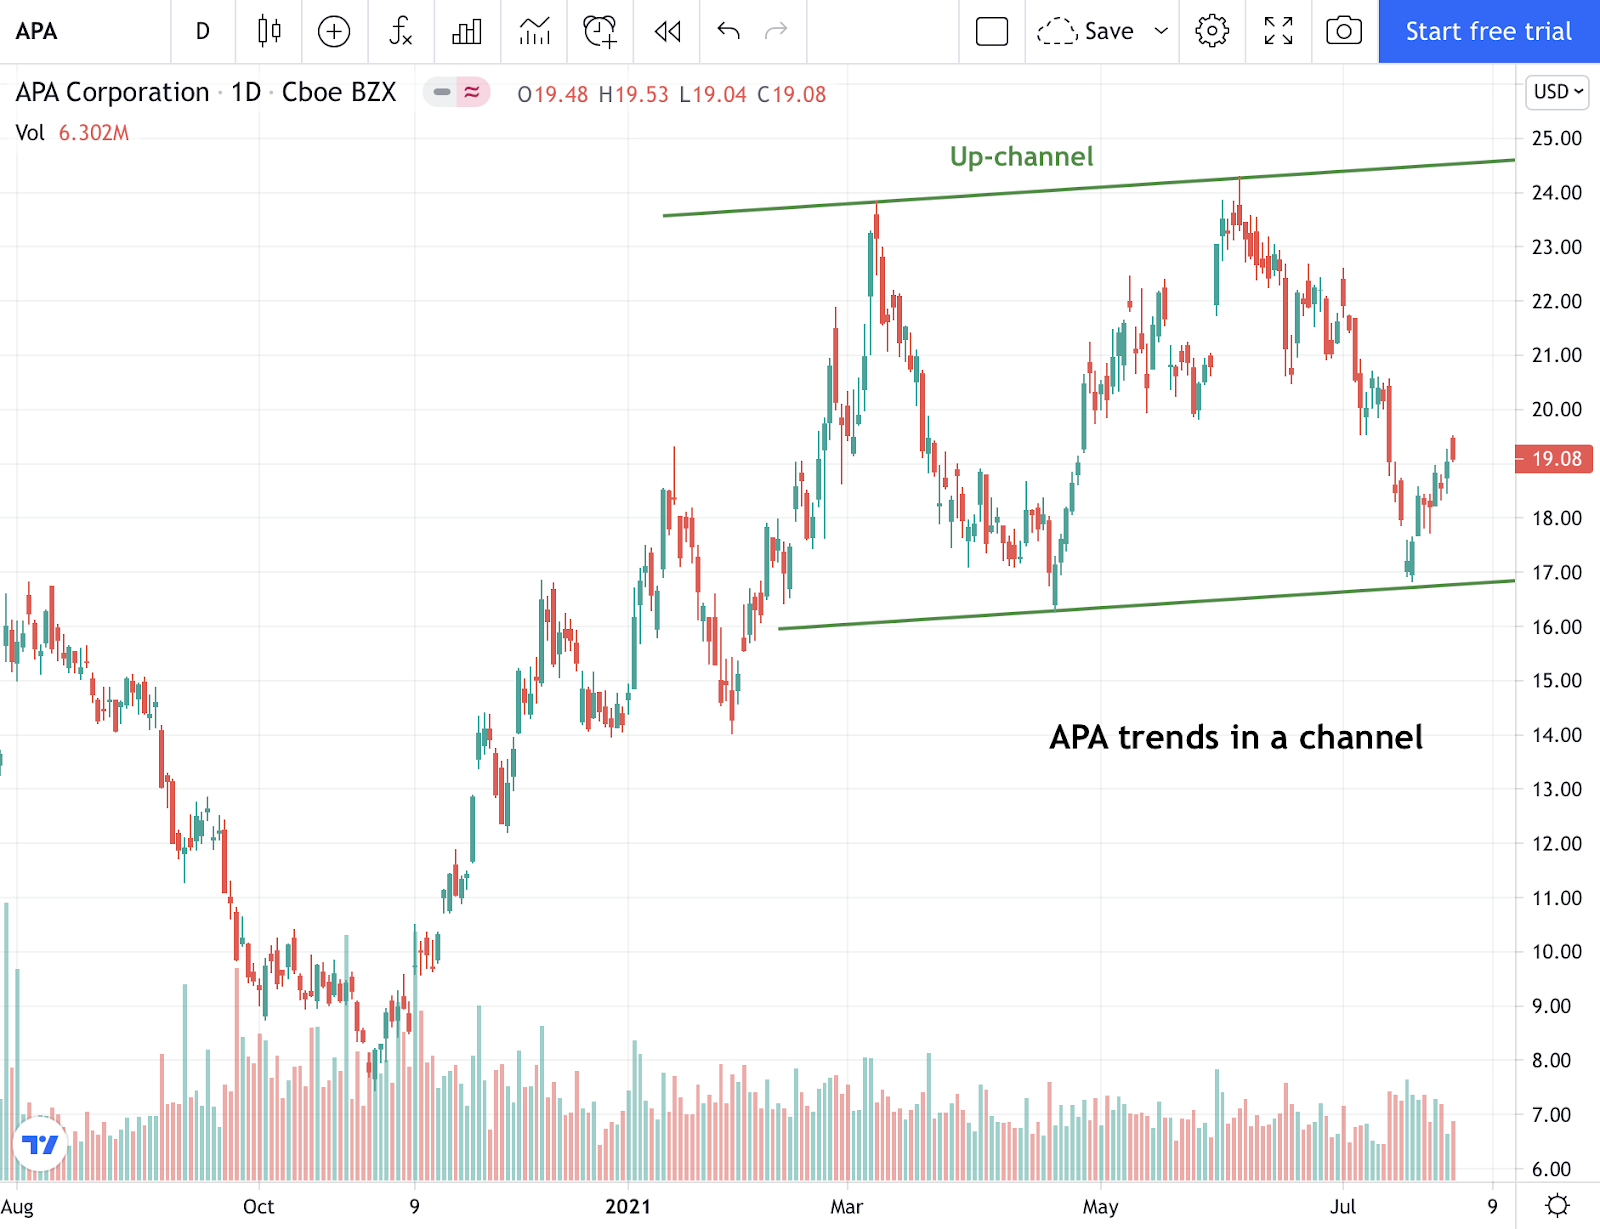
APA has formed an up-channel chart pattern over the past several months. A channel is formed through the combination of a trend line support that runs parallel to a trendline resistance. When it comes to channels, any (3) points can start the pattern, but a 4th test or more helps to confirm it.
Click Here to Read the Greatest Trading Book Ever Written
A long opportunity could be entered on a break above the trendline resistance. A short trade could be entered on a break below the channel support.
Want to Discover More Great Trades?
I have explored virtually every flavor of technical analysis and chart pattern known to mankind. The sad fact is that the vast majority of them don’t work at all.
That is why I recently put together this special report to help investors focus on the only 5 chart patterns that matter…the ones that lead to the most timely and profitable stock trades. Click below to get your copy now!
5 WINNING Stock Chart Patterns
Have a good trading day!
Good luck!
Christian Tharp, CMT
APA shares were trading at $18.77 per share on Friday morning, down $0.31 (-1.62%). Year-to-date, APA has gained 32.85%, versus a 18.15% rise in the benchmark S&P 500 index during the same period.
About the Author: Christian Tharp

I am an expert stock market coach having helped over 4000 beginner and advanced traders & investors from around the world take control of their financial futures. I also write stock market related articles for the Adam Mesh Trading Group and Yolo Publishing.
The post Is APA Setting Up for a Big Move? appeared first on StockNews.com