This week we get served up the Big 3 economic reports to give us a wide ranging view on the health of the economy.
Typically, these are market moving events. However, with stocks on such a tremendous bull run, then the good news is likely priced in and the risk remains to the downside.
The first of those reports came in today, ISM Manufacturing. So let’s discuss the results along with a preview of the other 2 to shape our market outlook and trading plan.
Last week the key event was the Fed announcement on Wednesday 7/26. I gave a pretty thorough analysis of the event in this commentary.
The summarized version is that there is good reason to believe the Fed has made their last rate hike. Further, they have improved their future economic outlook to where they believe inflation can be tamed without creating a recession.
Investors already assumed that to be the case which was the catalyst behind the nearly non-stop rally we have enjoyed since mid March. That is when fears of the banking concerns started to go away allowing the S&P 500 (SPY) to bounce from 3,855 to the present level that is getting ever closer to the all time highs.
With the Fed announcement by the way side, plus Q2 earnings season in line with modest expectations, now attention turns to the Big 3 economic reports that kick off each new month.
ISM Manufacturing got things started on Tuesday morning. It is hard to say with a straight face that the 46.4 reading is good when everything below 50 is a sign of economic contraction. However, it is a step up from the even weaker 46.0 last month. More importantly, the New Orders component rose from recent weakness which generally means future readings will be higher as well.
However, given the importance of full disclosure I will admit that the Employment component falling to 44.4 could be a sign that the jobs market is finally about to weaken. However, that would not necessarily lead to a sell off as that was expected at some point during this aggressive rate hike cycle.
More likely investors will see that as a sign that wage pressure will abate...which leads to a lower overall inflation picture...which means the Fed will start lowering rates soon rather than later making the future economic and stock market outlook that much brighter.
The next of these Big 3 reports is ISM Services which taps into a much larger swatch of the economy. Previously that spiked from 50.3 to 53.9 in the July reading. This time around investors are expecting a more modest 52.0 reading.
Not great. But not terrible for an economy where the Fed is still slamming on the brakes with the highest rates in over 20 years.
Honestly, anything north of 50 for this report would be a green light for bullish investors. Below that would strike a note of caution. But likely nothing more than a very small sell off.
Coming down the homestretch, on Friday investors will digest the monthly Government Employment Situation report. Remember that the jobs market has been surprisingly resilient over the past 17 months as the Fed has been raising rates. That is why once again the market is expecting healthy job adds in the neighborhood of 190,000.
Equally important to the number of job ads is the reading for wage inflation. That was a bit too hot at 4.4% year over year according to the July reading. That is expected to keep moderating at this meeting which will only further embolden the Fed to prepare for an end to the rate hikes and future decreases. That more accommodative stance will be better for the economy...and better for stock prices as they will look more attractive as interest rates decline.
Price Action & Trading Plan
Now let’s check in with the following S&P 500 price chart to see what it is tell us:
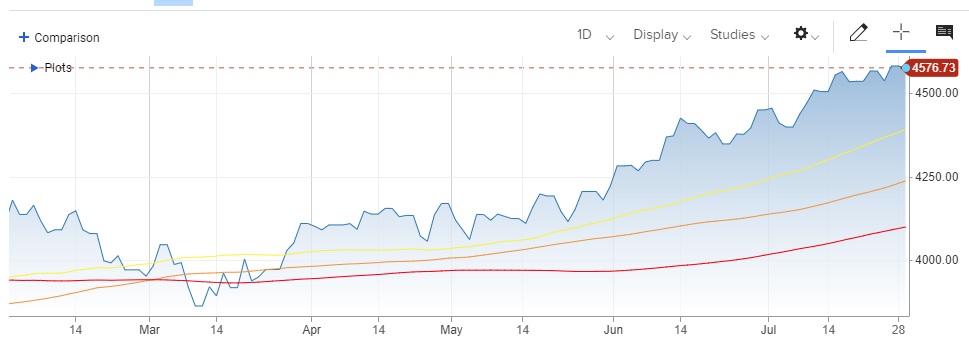
Moving Averages: 50 Day (yellow), 100 Day (orange), 200 Day (Red)
You already know the stock market keeps pressing higher. Thus, no surprise we are a good spot above any of the key moving averages. But at some point, investors will be compelled to finally take some profits off the table. That is the natural and healthy thing to do.
In fact, one of the most respected chartists I know believes that 4,600 is just that interim top the market needs to press pause.
The best possible outcome is that it is more of a consolidation or small trading range scenario for the S&P 500 as money FINALLY gets moved from the have’s (like the Magnificent 7) to some of the have nots (Financials, Industrials, Airlines). Also small and mid caps have a lot of catching up to do.
Long story short, there is no reason to play games. We are currently in a bull market and well above the key moving averages that would have one consider getting more defensive. Thus, wise to be at or near fully invested even if a modest pullback is in the offing.
In my book the key to outperformance is to realize the groups that led the charge the first half of the year are OVERRIPE and do to spoil. Better to find new groups that will lead the way going forward. And that is exactly what are focused on in the next section...
What To Do Next?
Discover my current portfolio of 5 stocks packed to the brim with the outperforming benefits found in our POWR Ratings model.
Plus I have added 5 ETFs that are all in sectors well positioned to outpace the market in the weeks and months ahead.
This is all based on my 43 years of investing experience seeing bull markets...bear markets...and everything between.
If you are curious to learn more, and want to see these 10 hand selected trades, then please click the link below to get started now.
Steve Reitmeister’s Trading Plan & Top Picks >
Wishing you a world of investment success!

Steve Reitmeister…but everyone calls me Reity (pronounced “Righty”)
CEO, StockNews.com and Editor, Reitmeister Total Return
SPY shares were trading at $456.48 per share on Tuesday afternoon, down $1.31 (-0.29%). Year-to-date, SPY has gained 20.26%, versus a % rise in the benchmark S&P 500 index during the same period.
About the Author: Steve Reitmeister

Steve is better known to the StockNews audience as “Reity”. Not only is he the CEO of the firm, but he also shares his 40 years of investment experience in the Reitmeister Total Return portfolio. Learn more about Reity’s background, along with links to his most recent articles and stock picks.
The post August Stock Market vs. Big 3 Economic Reports appeared first on StockNews.com