Silver reserves increase by 21% to more than 240 million ounces
Hecla Mining Company (NYSE: HL) today reported the highest silver reserves in its more than 130-year history and provided an update on its exploration programs during the fourth quarter 2022 and plans for 2023.
This press release features multimedia. View the full release here: https://www.businesswire.com/news/home/20230214005412/en/
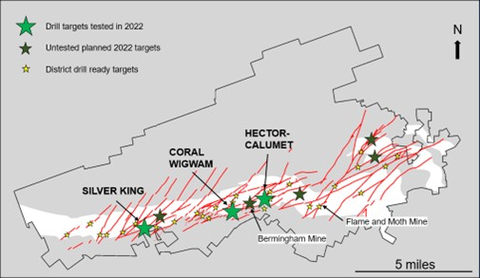
Figure 1: Plan map showing the location of the three exploration targets drill tested in 2022 in relation to the Bermingham and Flame and Moth deposits within the Keno Hill Property. (Graphic: Business Wire)
RESERVES & RESOURCES HIGHLIGHTS
- Silver reserves increased to more than 240 million ounces with the addition of Keno Hill’s almost 50 million silver ounces.
- Gold reserves decreased by 6% due to a higher cut-off grade at Casa Berardi reflecting rising costs.
- Measured and indicated silver and gold resources increased 6% with the inclusion of Keno Hill.
- Inferred resources are mostly unchanged with increases of 3% for silver and 1% for gold.
EXPLORATION HIGHLIGHTS
- Exploration drilling at Keno Hill focused on initial drill testing of new targets at the Silver King, Coral-Wigwam, and Hector-Calumet confirmed the occurrence of favorable vein structures and high-grade silver mineralization in all three areas.
- Exploration and definition drilling at Greens Creek defined and expanded mineralization on strike with strong assay results from the Southwest Bench, 200 South, East, West, and Upper Plate ore zones.
- Surface exploration drilling at Casa Berardi identified a mineralized smoky quartz vein system in the 154 Zone while underground drilling in the West Mine identified high grade gold in the 118 Zone.
“Hecla’s silver reserves are an all-time high,” said Phillips S. Baker, Jr., President, and CEO. “In the past 15 years, we have replaced the 213 million ounces mined and yet have almost 5 times the reserves we had at the start of 2008. That is over 400 million ounces of silver that we have replaced and grown. We now have a half dozen silver properties to explore, primarily in the US and Canada, the most recent addition being the 88 square mile Keno Hill project in the Yukon.”
Baker continued, “Keno Hill’s 2022 exploration results are particularly remarkable with only three targets drilled that all resulted in three meaningful, high-grade discoveries. This reflects the quality of the land position and the knowledge of the long-standing team who have taken their experience at Bermingham and applied it to the new targets. These initial results exceed our already high expectations for the exploration potential of the district.”
“Hecla has the largest silver reserve in the United States, the highest grade and largest primary silver reserve in Canada, the best silver exploration potential in both countries, and we produce 40% of all the silver mined on in the United States and expect to produce the same percentage of Canada’s production next year. With silver’s importance in the energy transition to renewables, Hecla is well positioned long into the future,” Baker said.
YEAR-END 2022 RESERVES AND RESOURCES
2022 proven and probable silver reserves were the highest in Hecla’s history at more than 240 million ounces.
On a consolidated basis, the Company replaced the 14 million ounces of silver produced during the year and increased proven and probable reserves by 21%, or 41 million ounces over 2021. The increase was primarily due to the acquisition of Keno Hill in Canada’s Yukon Territory. The Company’s gold production of more than 180,000 ounces was not replaced and proven and probable reserves declined 6% to 2.6 million ounces due to cost increases which increased the cut-off grade at Casa Berardi. Zinc production was replaced, and reserves increased 4% to 944 thousand tons. Lead production of 55 thousand tons was replaced with an increase of 7% to 785 thousand tons of reserves.
Reserve metal price assumptions for 2022 were $17/oz silver, $1,600/oz gold, $1.15/lb zinc, and $0.90/lb lead, unchanged from 2021.
Measured and indicated silver ounces increased 6% to 219 million ounces with increases at Greens Creek and the addition of Keno Hill which offset the decrease due to conversion of material to reserves at Lucky Friday. Measured and indicated gold ounces also increased 6% to 3.7 million ounces due mostly to increases at Casa Berardi.
Inferred silver resources increased 3% to 504 million ounces while inferred gold resources increased 1% to 5.7 million ounces due to increases at Greens Creek, Casa Berardi, and the inclusion of Keno Hill.
Resource metal price assumptions for 2022 were $21/oz silver, $1700/oz gold, $1.35/lb zinc and $1.15/lb lead, and $3/lb copper, also unchanged from 2021.
Greens Creek
At Greens Creek, 2022 production was not replaced, where silver, gold, zinc, and lead reserves decreased by 7%, 1%, 4%, and 6%, respectively, over 2021 reserves. Lower margin material and material adjacent to historically mined areas with unknown backfill conditions was removed. A study is reviewing if some of this material may be returned to reserve.
Measured and indicated silver resources at year-end 2022 were 109 million ounces, a 2% increase over 2021 due to drilling and resource conversion. Inferred silver resources increased 5% from exploration drilling to a total of 29 million ounces.
Casa Berardi
At Casa Berardi, mining depletion was not replaced, and gold reserves decreased 10% to 1.6 million ounces due to increased costs which increased cut-off grades.
Measured and indicated gold resources increased 19% to 1.3 million ounces due drilling as well as the cutoff grade converting material from reserves. Inferred gold resources increased 4% from exploration drilling.
Lucky Friday
At the Lucky Friday, mining of 4.8 million ounces of silver was replaced, and proven and probable silver reserves are unchanged from 2021 at 74.7 million ounces of silver. Proven and Probable lead reserves increased 3% to 468 thousand tons and zinc reserves increased 10% to 200 thousand tons.
Measured and indicated silver resources decreased 27% to 58 million ounces; lead and zinc measured and indicated resources decreased 23% and 27%, respectively. Decreases in measured and indicated resources are due to conversion to reserves (4.9 million silver ounces, 39 thousand lead tons, and 28 thousand zinc tons) and increased cut-off grades removing some material.
Inferred resources decreased year-over-year and include 31 million ounces of silver, a decrease of 25%; 225 thousand tons of lead, a decrease of 28%; and 85 thousand tons of zinc, a decrease of 35%. Decreases in inferred resources is mostly due to increased costs and increased cut-off grades along the edges of the resources and at the higher elevations of the 30 Vein. Drilling of inferred resources on the 30 Vein also converted material to higher resource classes and added 3 million ounces to reserve.
Keno Hill
The acquisition of Keno Hill added nearly 50 million silver ounces to Hecla’s reserve base along with 53 thousand tons of lead and 49 thousand tons of zinc. This is an increase of approximately 12 million silver ounces or 33% over the reserves identified at the time of acquisition. The increase is due primarily to infill drilling of the Deep Northeast Zone at Bermingham.
In addition to the increased reserves, Keno Hill added 32 million silver ounces to measured and indicated resources and 26 million silver ounces to inferred resources.
A breakdown of the Company’s reserves and resources is set out in Table A at the end of this news release.
EXPLORATION AND PRE-DEVELOPMENT UPDATE
Exploration and pre-development expenses totaled $6.9 million for the fourth quarter and $46.0 million for the year 2022.
Exploration Update for Fourth Quarter, 2022
Keno Hill, Yukon Territory
At Keno Hill, two surface core drills confirmed high-grade silver mineralization at the Silver King, Coral-Wigwam, and Hector-Calumet targets (Figure 1). Mineralization at all three target areas are broad structural analogs to the nearby Bermingham deposit representing a successful application of the ore control model where northeast trending transverse structures intercept east-northeast trending longitudinal structures. While most known high-grade mineralization is hosted within the basal quartzite, several of the mineralized intercepts at both Coral Wigwam and Silver King are hosted above the favorable host. Also, the Silver King intercepts are located on the longitudinal-oriented structures. So, these results require a reevaluation of other targets in the same setting.
Coral Wigwam: At Coral Wigwam, the Walleye Vein assay results to date include:
- Drillhole K-22-0825 (Walleye): 101 oz/ton silver, 0.1% zinc, 0.1% lead, and 0.3% copper over 7.3 feet estimated true width. This intercept includes a narrower zone grading 2,522 oz/ton silver, 0.7% zinc, 0.3% lead, and 8.1% copper over 0.3 feet estimated true width.
Hector Calumet: The new Chance Vein was discovered 300 feet to the southeast of the historical 96 million ounce silver producing Hector-Calumet mine. Assay results to date include:
- Drillhole K-22-0829 (Chance): 5 oz/ton silver, 0.5% zinc, and 1.1% lead over 24.6 feet estimated true width. This intercept includes a narrower zone grading 9.6 oz/ton silver, 0.8% zinc, and 2.5% lead over 10.5 feet estimated true width.
- Drillhole K-22-0834 (Chance): 22 oz/ton silver, 6.4% zinc, and 2.3% lead over 2.3 feet estimated true width.
- Drillhole K-22-0837 (Chance): 10.5 oz/ton silver, 4.0% zinc, and 1.1% lead over 11.0 feet estimated true width including 47.2 oz/ton silver, 33.0% zinc, and 0.7% lead over 1.1 feet estimated true width.
Silver King: At Silver King, multiple mineralized veins were intersected including the Adam, No. 5, No. 6, and new No. 6 Splay veins. Significantly, many of these highly mineralized intervals are hosted in historically less productive portions of the Keno Hill stratigraphy that overlay and are projected into the more favorable basal quartzite. Assay results to date include:
- Drillhole K-22-0804 (Adam): 38.8 oz/ton silver, 4.7% zinc, and 1.4% lead over 1.9 feet estimated true width.
-
Drillhole K-22-0810 (No. 6 Splay): 7.9 oz/ton silver, 0.9% zinc, and 0.2% lead over 16.3 feet estimated true width including:
- 31.6 oz/ton silver, 1.9% zinc, and 0.3% lead over 3.0 feet estimated true width.
-
Drillhole K-22-0810 (No. 6): 19.6 oz/ton silver, 0.2% zinc, and 0.9% lead over 11.7 feet estimated true width including:
- 52.7 oz/ton silver, 0.3% zinc, and 2% lead over 4 feet estimated true width.
- Drillhole K-22-0812 (No. 5): 11 oz/ton silver, and 0.8% lead over 5.5 feet.
Detailed complete drill assay highlights can be found in Table B at the end of the release.
Greens Creek, Alaska
At Greens Creek, four underground drills converted resources in the 200 South, East, Gallagher, and West ore zones as well as exploration on the southern extension of the West and Gallagher Fault Block zones (Figure 2). Additionally, two helicopter-supported programs drilled the Upper Plate Zone and Lil’Sore to the northwest of the mine. Assay results were received for the Southwest Bench, 200 South, East, West, and Upper Plate areas and results continue to confirm and expand mineral zones but were not yet included in the reserve calculation.
Upper Plate Zone: Surface exploration drilling expanded mineralization 40 feet to the west from previous mineralized intercepts. Highlights from this drilling include:
- 8.9 oz/ton silver, 0.14 oz/ton gold, 12.1% zinc and 4.8% lead over 12.6 feet.
- 11.9 oz/ton silver, 0.17 oz/ton gold, 17.3% zinc, and 7.8% lead over 7.6 feet.
200 South Zone: Drilling tested 200 feet of strike length and infilled between existing drill intercepts. Highlights include:
- 35.0 oz/ton silver, 0.56 oz/ton gold, 9.2% zinc, and 4.5% lead over 13.0 feet.
East Zone: Drilling infilled over a strike length of 250 feet and tested the lower portion of the East Zone. Highlights include:
- 15.9 oz/ton silver, 0.10 oz/ton gold, 15.6% zinc, and 7.7% lead over 15.8 feet.
- 26.2 oz/ton silver, 0.23 oz/ton gold, 10.2% zinc, and 3.6% lead over 4.0 feet.
- 18.7 oz/ton silver, 0.10 oz/ton gold, 7.5% zinc, and 3.3% lead over 16.4 feet.
Detailed complete drill assay highlights can be found in Table B at the end of the release.
Casa Berardi, Quebec
At Casa Berardi, up to six underground core drills and two surface core drills were focused on definition and exploration drilling in multiple zones and targets in the West Mine, Principal Mine, and East Mine areas.
West Mine: Underground drilling targeted the 113 and 118 zones. Highlights include:
- 113 Zone: 0.12 oz/ton gold over 12.1 feet, including 0.21 oz/ton gold over 6.2 feet.
- 113 Zone: 0.11 oz/ton gold over 12.5 feet.
- 118 Zone: 0.39 oz/ton gold over 10.8 feet, including 3.32 oz/ton gold over 1.0 feet.
- 118 Zone: 0.29 oz/ton gold over 12.5 feet, including 1.14 oz/ton gold over 3.0 feet.
East Mine: Underground drilling targeted the 148-01 lens while surface exploration drilling targeted the 152 Zone and discovered the 154 zone. This new zone is near the contact between a greywacke sedimentary unit and an andesitic lava flow with up to 5% arsenopyrite and is open in all directions. Highlights include:
- 148 Zone: 0.27 oz/ton gold over 20.3 feet.
- 154 Zone: 0.15 oz/ton gold over 15.5 feet.
More complete drill assay highlights can be found in Table B at the end of the release.
2023 Exploration Program
Exploration and pre-development expenditures are anticipated to be $32.5 million in 2023, with about 70% of exploration expenditures being deployed at Greens Creek (26%), Casa Berardi (21%), Keno Hill (14%) and Aurora (6%).
At Greens Creek, underground definition drilling will focus on the 200 South, Upper Plate, 9A, West, Northwest West, Southwest, and East ore zones while underground exploration will focus on the 200 South, Gallagher, Gallagher Fault Block zones, the northern end of the East Ore Zone and up dip from the northern end of the West Ore Zone. Surface exploration drilling will focus on the Upper Plate Zone, the western part of the Gallagher Fault zone, the eastern part of the East Zone and the Lil’Sore prospect, which is the most anomalous and untested target away from the mine.
At Keno Hill, underground definition drilling will be at the Bermingham Bear Zone and the Flame & Moth Lightning Zone while surface exploration will focus on expanding the high-grade veins at the Hector-Calumet, Coral-Wigwam and Silver King target areas, the upflow zones below the Bermingham NE Zone and the untested zones above the Bermingham Deep NE Zone.
At Casa Berardi, underground definition drilling will be at the 118, 121, 123, 146 and 148 Zones. Exploration drilling will be on the high-grade extensions of the Lower Inter, 113-116, 118, 123, 134, 146, 148 and 152 to 157 zones. Regional surface exploration drilling will test anomalies from the sonic drilling program in the east and west block.
Nevada exploration is primarily at Aurora following up on Juniata and Chesco and drill testing the Sawtooth Ridge and Humboldt Offset target.
ABOUT HECLA
Founded in 1891, Hecla Mining Company (NYSE: HL) is the largest silver producer in the United States. In addition to operating mines in Alaska and Idaho, and Quebec, Canada, the Company owns a number of exploration and pre-development properties in world-class silver and gold mining districts throughout North America.
Cautionary Statements Regarding Estimates and Forward-Looking Statements, Including 2023 Outlook
Statements made or information provided in this news release that are not historical facts are "forward-looking statements" within the meaning of Section 27A of the Securities Act of 1933, as amended, and Section 21E of the Securities Exchange Act of 1934, as amended, which are intended to be covered by the safe harbor created by such sections and other applicable laws, and "forward-looking information" within the meaning of Canadian securities laws. When a forward-looking statement expresses or implies an expectation or belief as to future events or results, such expectation or belief is expressed in good faith and believed to have a reasonable basis. However, such statements are subject to risks, uncertainties and other factors, which could cause actual results to differ materially from future results expressed, projected or implied by the forward-looking statements. Forward-looking statements often address our expected future business and financial performance and financial condition and often contain words such as “anticipate,” “intend,” “plan,” “will,” “could,” “would,” “estimate,” “should,” “expect,” “believe,” “project,” “target,” “indicative,” “preliminary,” “potential” and similar expressions. Forward-looking statements in this news release may include, without limitation: (i) Keno Hill will be in consistent production in 2023; (ii) the Company has the potential to be the largest silver producer in the U.S. and Canada; (iii) the Company will be able to achieve mine-specific and Company-wide 2023 estimates of future production; (iv) Exploration and pre-development spend for 2023 will be in line with guidance and deployed between projects and properties; and (iv) Lucky Friday throughput expected to increase in the future. Estimates or expectations of future events or results are based upon certain assumptions, which may prove to be incorrect, which could cause actual results to differ from forward-looking statements. Such assumptions, include, but are not limited to: (i) there being no significant change to current geotechnical, metallurgical, hydrological and other physical conditions; (ii) permitting, development, operations and expansion of the Company’s projects being consistent with current expectations and mine plans; (iii) political/regulatory developments in any jurisdiction in which the Company operates being consistent with its current expectations; (iv) certain price assumptions for gold, silver, lead and zinc; (v) prices for key supplies being approximately consistent with current levels; (vi) the accuracy of our current mineral reserve and mineral resource estimates; (vii) the Company’s plans for development and production will proceed as expected and will not require revision as a result of risks or uncertainties, whether known, unknown or unanticipated; (viii) sufficient workforce is available and trained to perform assigned tasks; (ix) weather patterns and rain/snowfall within normal seasonal ranges so as not to impact operations; (x) relations with interested parties, including Native Americans, remain productive; and (xi) factors do not arise that reduce available cash balances.
In addition, material risks that could cause actual results to differ from forward-looking statements include but are not limited to: (i) gold, silver and other metals price volatility; (ii) operating risks; (iii) currency fluctuations; (iv) increased production costs and variances in ore grade or recovery rates from those assumed in mining plans; (v) community relations; and (vi) litigation, political, regulatory, labor and environmental risks. For a more detailed discussion of such risks and other factors, see the Company's 2021 Form 10-K filed on February 22, 2022, and Form 10-Q filed on August 5, 2022 for a more detailed discussion of factors that may impact expected future results. The Company undertakes no obligation and has no intention of updating forward-looking statements other than as may be required by law.
Cautionary Statements to Investors on Reserves and Resources
This news release uses the terms “mineral resources”, “measured mineral resources”, “indicated mineral resources” and “inferred mineral resources”. Mineral resources that are not mineral reserves do not have demonstrated economic viability. You should not assume that all or any part of measured or indicated mineral resources will ever be converted into mineral reserves. Further, inferred mineral resources have a great amount of uncertainty as to their existence and as to whether they can be mined legally or economically, and an inferred mineral resource may not be considered when assessing the economic viability of a mining project, and may not be converted to a mineral reserve. On October 31, 2018, the SEC adopted new mining disclosure rules (“S-K 1300”) that is more closely aligned with current industry and global regulatory practices and standards, including National Instrument 43-101 – Standards of Disclosure for Mineral Projects (“NI 43-101”) which we comply with because we also are a “reporting issuer” under Canadian securities laws. While S-K 1300 is more closely aligned with NI 43-101 than the prior SEC mining disclosure rules, there are some differences. NI 43-101 is a rule developed by the Canadian Securities Administrators, which established standards for all public disclosure an issuer makes of scientific and technical information concerning mineral projects. Unless otherwise indicated, all resource and reserve estimates contained in this press release have been prepared in accordance with NI 43-101, as well as S-K 1300.
Qualified Person (QP)
Kurt D. Allen, MSc., CPG, VP - Exploration of Hecla Mining Company and Keith Blair, MSc., CPG, Chief Geologist of Hecla Limited, who serve as a Qualified Person under S-K 1300 and NI 43-101, supervised the preparation of the scientific and technical information concerning Hecla’s mineral projects in this news release. Technical Report Summaries (each a “TRS”) for each of the Company’s material properties are filed as exhibits 96.1, 96.2 and 96.3 to the Company’s Annual Report on Form 10-K for the year ended December 31, 2021 and are available at www.sec.gov. Information regarding data verification, surveys and investigations, quality assurance program and quality control measures and a summary of analytical or testing procedures for (i) the Greens Creek Mine are contained in its TRS and in a NI 43-101 technical report titled “Technical Report for the Greens Creek Mine” effective date December 31, 2018, (ii) the Lucky Friday Mine are contained in its TRS and in its technical report titled “Technical Report for the Lucky Friday Mine Shoshone County, Idaho, USA” effective date April 2, 2014, (iii) Casa Berardi are contained in its TRS and in its technical report titled “Technical Report on the mineral resource and mineral reserve estimate for Casa Berardi Mine, Northwestern Quebec, Canada” effective date December 31, 2018, and (iv) the San Sebastian Mine, Mexico, are contained in a technical report prepared for Hecla titled “Technical Report for the San Sebastian Ag-Au Property, Durango, Mexico” effective date September 8, 2015. Also included in each TRS and the four technical reports is a description of the key assumptions, parameters and methods used to estimate mineral reserves and resources and a general discussion of the extent to which the estimates may be affected by any known environmental, permitting, legal, title, taxation, socio-political, marketing, or other relevant factors. Information regarding data verification, surveys and investigations, quality assurance program and quality control measures and a summary of sample, analytical or testing procedures are contained in technical reports prepared for Klondex Mines Ltd. for (i) the Fire Creek Mine (technical report dated March 31, 2018), (ii) the Hollister Mine (technical report dated May 31, 2017, amended August 9, 2017), and (iii) the Midas Mine (technical report dated August 31, 2014, amended April 2, 2015). Copies of these technical reports are available under Hecla’s profile on SEDAR at www.sedar.com. Mr. Allen and Mr. Blair reviewed and verified information regarding drill sampling, data verification of all digitally collected data, drill surveys and specific gravity determinations relating to all the mines. The review encompassed quality assurance programs and quality control measures including analytical or testing practice, chain-of-custody procedures, sample storage procedures and included independent sample collection and analysis. This review found the information and procedures meet industry standards and are adequate for Mineral Resource and Mineral Reserve estimation and mine planning purposes.
TABLE A |
|||||||||
Mineral Reserves – 12/31/2022 (1) |
|||||||||
Proven Reserves (1) |
|||||||||
Asset |
Tons (000) |
Silver (oz/ton) |
Gold (oz/ton) |
Lead % |
Zinc % |
Silver (000 oz) |
Gold (000 oz) |
Lead Tons |
Zinc Tons |
Greens Creek (2,3) |
7 |
16.1 |
0.07 |
2.3 |
5.4 |
108 |
0.4 |
150 |
360 |
Lucky Friday (2,4) |
4,734 |
13.8 |
- |
8.6 |
3.7 |
64,638 |
- |
404,160 |
174,510 |
Casa Berardi Underground (2,5) |
552 |
- |
0.17 |
- |
- |
- |
95 |
- |
- |
Casa Berardi Open Pit (2,5) |
4,410 |
- |
0.09 |
- |
- |
- |
417 |
- |
- |
Keno Hill (2,6) |
- |
- |
- |
- |
- |
- |
- |
- |
- |
Total |
9,703 |
|
|
|
|
64,746 |
512 |
404,310 |
174,870 |
|
|
|
|
|
|
|
|
|
|
Probable Reserves (7) |
|||||||||
Asset |
Tons (000) |
Silver (oz/ton) |
Gold (oz/ton) |
Lead % |
Zinc % |
Silver (000 oz) |
Gold (000 oz) |
Lead (Tons) |
Zinc (Tons) |
Greens Creek (2,3) |
10,668 |
10.9 |
0.09 |
2.5 |
6.5 |
116,748 |
935 |
264,600 |
694,800 |
Lucky Friday (2,4) |
840 |
12.8 |
- |
8.1 |
3.2 |
9,978 |
- |
63,510 |
25,030 |
Casa Berardi Underground (2,5) |
989 |
- |
0.17 |
- |
- |
- |
166 |
- |
- |
Casa Berardi Open Pit (2,5) |
12,434 |
- |
0.08 |
- |
- |
- |
936 |
- |
- |
Keno Hill (2,6) |
2,197 |
22.5 |
0.01 |
2.4 |
2.2 |
49,473 |
13 |
52,520 |
49,320 |
Total |
27,128 |
|
|
|
|
176,199 |
2,050 |
380,630 |
769,150 |
|
|
|
|
|
|
|
|
|
|
Proven and Probable Reserves |
|||||||||
Asset |
Tons (000) |
Silver (oz/ton) |
Gold (oz/ton) |
Lead % |
Zinc % |
Silver (000 oz) |
Gold (000 oz) |
Lead (Tons) |
Zinc (Tons) |
Greens Creek (2,3) |
10,675 |
10.9 |
0.09 |
2.5 |
6.5 |
116,856 |
935 |
264,750 |
695,160 |
Lucky Friday (2,4) |
5,574 |
13.4 |
- |
8.4 |
3.6 |
74,616 |
- |
467,670 |
199,530 |
Casa Berardi Underground (2,5) |
1,541 |
- |
0.17 |
- |
- |
- |
261 |
- |
- |
Casa Berardi Open Pit (2,5) |
16,844 |
- |
0.08 |
- |
- |
- |
1,353 |
- |
- |
Keno Hill (2,6) |
2,197 |
22.5 |
0.01 |
2.4 |
2.2 |
49,473 |
13 |
52,520 |
49,320 |
Total |
36,829 |
|
|
|
|
240,945 |
2,562 |
784,940 |
944,020 |
(1) |
The term “reserve” means an estimate of tonnage and grade or quality of indicated and measured mineral resources that, in the opinion of the qualified person, can be the basis of an economically viable project. More specifically, it is the economically mineable part of a measured or indicated mineral resource, which includes diluting materials and allowances for losses that may occur when the material is mined or extracted. The term “proven reserves” means the economically mineable part of a measured mineral resource and can only result from conversion of a measured mineral resource. See footnotes 8 and 9 below. |
|
(2) |
Mineral reserves are based on $17/oz silver, $1600/oz gold, $0.90/lb lead, $1.15/lb zinc, unless otherwise stated. All Mineral Reserves are reported in-situ with estimates of mining dilution and mining loss. |
|
(3) |
The reserve NSR cut-off values for Greens Creek are $210/ton for all zones except the Gallagher Zone at $215/ton; metallurgical recoveries (actual 2022): 81% for silver, 72% for gold, 82% for lead, and 89% for zinc. |
|
(4) |
The reserve NSR cut-off values for Lucky Friday are $241.34/ton for the 30 Vein and $268.67/ton for the Intermediate Veins; metallurgical recoveries (actual 2022): 95% for silver, 95% for lead, and 88% for zinc |
|
(5) |
The average reserve cut-off grades at Casa Berardi are 0.12 oz/ton gold underground and 0.04 oz/ton gold for open pit. Metallurgical recovery (actual 2022): 87% for gold; US$/CAN$ exchange rate: 1:1.3. |
|
(6) |
The reserve NSR cut-off value at Keno Hill is $244.24/ton (CAN$350/tonne), Metallurgical recovery: 93% for silver, 25% for gold, 93% for lead, 72% for zinc; US$/CAN$ exchange rate: 1:1.3 |
|
(7) |
The term “probable reserves” means the economically mineable part of an indicated and, in some cases, a measured mineral resource. See footnotes 9 and 10 below. |
|
Totals may not represent the sum of parts due to rounding. |
||
Mineral Resources – 12/31/2022 (8) |
|||||||||||
Measured Resources (9) |
|||||||||||
Asset |
Tons (000) |
Silver (oz/ton) |
Gold (oz/ton) |
Lead % |
Zinc % |
Copper % |
Silver (000 oz) |
Gold (000 oz) |
Lead (Tons) |
Zinc (Tons) |
Copper (Tons) |
Greens Creek (12,13) |
- |
- |
- |
- |
- |
- |
- |
- |
- |
- |
- |
Lucky Friday (12,14) |
6,237 |
7.8 |
- |
5.4 |
2.6 |
- |
48,551 |
- |
335,850 |
161,000 |
- |
Casa Berardi Underground (12,15) |
2,440 |
- |
0.22 |
- |
- |
- |
- |
530 |
- |
- |
- |
Casa Berardi Open Pit (12,15) |
483 |
- |
0.04 |
- |
- |
- |
- |
20 |
- |
- |
- |
Keno Hill (12,16) |
- |
- |
- |
- |
- |
- |
- |
- |
- |
- |
- |
San Sebastian - Oxide (17) |
- |
- |
- |
- |
- |
- |
- |
- |
- |
- |
- |
San Sebastian - Sulfide (17) |
- |
- |
- |
- |
- |
- |
- |
- |
- |
- |
- |
Fire Creek (18,19) |
- |
- |
- |
- |
- |
- |
- |
- |
- |
- |
- |
Hollister (18,20) |
18 |
4.9 |
0.59 |
- |
- |
- |
87 |
10 |
- |
- |
- |
Midas (18,21) |
2 |
7.6 |
0.68 |
- |
- |
- |
14 |
1 |
- |
- |
- |
Heva (22) |
- |
- |
- |
- |
- |
- |
- |
- |
- |
- |
- |
Hosco (22) |
- |
- |
- |
- |
- |
- |
- |
- |
- |
- |
- |
Star (12,23) |
- |
- |
- |
- |
- |
- |
- |
- |
- |
- |
- |
Total |
9,180 |
|
|
|
|
|
48,652 |
561 |
335,850 |
161,000 |
- |
Indicated Resources (10) |
|||||||||||
Asset |
Tons (000) |
Silver (oz/ton) |
Gold (oz/ton) |
Lead % |
Zinc % |
Copper % |
Silver (000 oz) |
Gold (000 oz) |
Lead (Tons) |
Zinc (Tons) |
Copper (Tons) |
Greens Creek (12,13) |
8,421 |
12.9 |
0.10 |
2.9 |
8.0 |
- |
108,717 |
810 |
245,990 |
675,740 |
- |
Lucky Friday (12,14) |
1,194 |
8.0 |
- |
5.4 |
2.2 |
- |
9,581 |
- |
64,390 |
26,200 |
- |
Casa Berardi Underground (12,15) |
3,870 |
- |
0.17 |
- |
- |
- |
- |
660 |
- |
- |
- |
Casa Berardi Open Pit (12,15) |
1,323 |
- |
0.04 |
- |
- |
- |
- |
48 |
- |
- |
- |
Keno Hill (12,16) |
4,061 |
8.0 |
0.007 |
1.0 |
4.0 |
- |
32,288 |
29 |
39,540 |
163,130 |
- |
San Sebastian - Oxide (17) |
1,453 |
6.5 |
0.09 |
- |
- |
- |
9,430 |
135 |
- |
- |
- |
San Sebastian - Sulfide (17) |
1,187 |
5.5 |
0.01 |
1.9 |
2.9 |
1.2 |
6,579 |
16 |
22,420 |
34,100 |
14,650 |
Fire Creek (18,19) |
112 |
1.1 |
0.53 |
- |
- |
- |
122 |
59 |
- |
- |
- |
Hollister (18,20) |
70 |
1.9 |
0.58 |
- |
- |
- |
130 |
40 |
- |
- |
- |
Midas (18,21) |
76 |
5.7 |
0.42 |
- |
- |
- |
430 |
32 |
- |
- |
- |
Heva (22) |
1,266 |
- |
0.06 |
- |
- |
- |
- |
76 |
- |
- |
- |
Hosco (22) |
29,287 |
- |
0.04 |
- |
- |
- |
- |
1,202 |
- |
- |
- |
Star (12,23) |
1,068 |
3.0 |
- |
6.4 |
7.7 |
- |
3,177 |
- |
67,970 |
82,040 |
- |
Total |
53,388 |
|
|
170,454 |
3,107 |
440,310 |
981,210 |
14,650 |
|||
Measured & Indicated Resources |
|||||||||||
Asset |
Tons (000) |
Silver (oz/ton) |
Gold (oz/ton) |
Lead % |
Zinc % |
Copper % |
Silver (000 oz) |
Gold (000 oz) |
Lead (Tons) |
Zinc (Tons) |
Copper (Tons) |
Greens Creek (12,13) |
8,421 |
12.9 |
0.10 |
2.9 |
8.0 |
- |
108,717 |
810 |
245,990 |
675,740 |
- |
Lucky Friday (12,14) |
7,431 |
7.8 |
- |
5.4 |
2.5 |
- |
58,132 |
- |
400,240 |
187,200 |
- |
Casa Berardi Underground (12,15) |
6,310 |
- |
0.19 |
- |
- |
- |
- |
1,190 |
- |
- |
- |
Casa Berardi Open Pit (12,15) |
1,806 |
- |
0.04 |
- |
- |
- |
- |
67 |
- |
- |
- |
Keno Hill (12,16) |
4,061 |
8.0 |
0.007 |
1.0 |
4.0 |
- |
32,288 |
29 |
39,540 |
163,130 |
- |
San Sebastian - Oxide (17) |
1,453 |
6.5 |
0.09 |
- |
- |
- |
9,430 |
135 |
- |
- |
- |
San Sebastian - Sulfide (17) |
1,187 |
5.5 |
0.01 |
1.9 |
2.9 |
1.2 |
6,579 |
16 |
22,420 |
34,100 |
14,650 |
Fire Creek (18,19) |
112 |
1.1 |
0.53 |
- |
- |
- |
122 |
59 |
- |
- |
- |
Hollister (18,20) |
88 |
2.5 |
0.58 |
- |
- |
- |
217 |
51 |
- |
- |
- |
Midas (18,21) |
78 |
5.7 |
0.43 |
- |
- |
- |
444 |
33 |
- |
- |
- |
Heva (22) |
1,266 |
- |
0.06 |
- |
- |
- |
- |
76 |
- |
- |
- |
Hosco (22) |
29,287 |
- |
0.04 |
- |
- |
- |
- |
1,202 |
- |
- |
- |
Star (12,23) |
1,068 |
3.0 |
- |
6.4 |
7.7 |
- |
3,177 |
- |
67,970 |
82,040 |
- |
Total |
62,568 |
|
|
|
|
|
219,106 |
3,668 |
776,160 |
1,142,210 |
14,650 |
Inferred Resources (11) |
|||||||||||
Asset |
Tons (000) |
Silver (oz/ton) |
Gold (oz/ton) |
Lead % |
Zinc % |
Copper % |
Silver (000 oz) |
Gold (000 oz) |
Lead (Tons) |
Zinc (Tons) |
Copper (Tons) |
Greens Creek (12,13) |
2,383 |
12.1 |
0.07 |
2.8 |
6.9 |
- |
28,949 |
178 |
67,400 |
164,080 |
- |
Lucky Friday (12,14) |
3,592 |
8.7 |
- |
6.3 |
2.4 |
- |
31,264 |
- |
224,670 |
84,700 |
- |
Casa Berardi Underground(12,15) |
2,221 |
- |
0.19 |
- |
- |
- |
- |
430 |
- |
- |
- |
Casa Berardi Open Pit (12,15) |
7,828 |
- |
0.05 |
- |
- |
- |
- |
389 |
- |
- |
- |
Keno Hill (12,16) |
2,441 |
10.4 |
0.003 |
0.9 |
2.1 |
- |
25,478 |
8 |
22,380 |
51,000 |
- |
San Sebastian - Oxide (17) |
3,490 |
6.4 |
0.05 |
- |
- |
- |
22,353 |
182 |
- |
- |
- |
San Sebastian - Sulfide (17) |
385 |
4.2 |
0.01 |
1.6 |
2.3 |
0.9 |
1,606 |
5 |
6,070 |
8,830 |
3,330 |
Fire Creek (18,19) |
765 |
0.5 |
0.51 |
- |
- |
- |
394 |
392 |
- |
- |
- |
Fire Creek - Open Pit (24) |
74,584 |
0.1 |
0.03 |
- |
- |
- |
5,232 |
2,178 |
- |
- |
- |
Hollister (18,20) |
642 |
3.0 |
0.42 |
- |
- |
- |
1,916 |
273 |
- |
- |
- |
Midas (18,21) |
1,232 |
6.3 |
0.50 |
- |
- |
- |
7,723 |
615 |
- |
- |
- |
Heva (22) |
2,787 |
- |
0.08 |
- |
- |
- |
- |
216 |
- |
- |
- |
Hosco (22) |
17,726 |
- |
0.04 |
- |
- |
- |
- |
663 |
- |
- |
- |
Star (12,23) |
2,851 |
3.1 |
- |
5.9 |
5.9 |
- |
8,795 |
- |
168,180 |
166,930 |
- |
San Juan Silver (12,25) |
2,570 |
11.3 |
0.01 |
1.4 |
1.1 |
- |
38,203 |
34 |
49,400 |
39,850 |
- |
Monte Cristo (26) |
913 |
0.3 |
0.14 |
- |
- |
- |
271 |
131 |
- |
- |
- |
Rock Creek (12,27) |
100,086 |
1.5 |
- |
- |
- |
0.7 |
148,736 |
- |
- |
- |
658,680 |
Montanore (12,28) |
112,185 |
1.6 |
- |
- |
- |
0.7 |
183,346 |
- |
- |
- |
759,420 |
Total |
338,681 |
|
|
|
|
|
504,266 |
5,694 |
538,100 |
515,390 |
1,421,430 |
Note: All estimates are in-situ except for the proven reserves at Greens Creek which are in surface stockpiles. Mineral resources are exclusive of reserves. |
|
(8) The term "mineral resources" means a concentration or occurrence of material of economic interest in or on the Earth's crust in such form, grade or quality, and quantity that there are reasonable prospects for economic extraction. A mineral resource is a reasonable estimate of mineralization, taking into account relevant factors such as cut-off grade, likely mining dimensions, location or continuity, that, with the assumed and justifiable technical and economic conditions, is likely to, in whole or in part, become economically extractable. It is not merely an inventory of all mineralization drilled or sampled. |
(9) The term "measured resources" means that part of a mineral resource for which quantity and grade or quality are estimated on the basis of conclusive geological evidence and sampling. The level of geological certainty associated with a measured mineral resource is sufficient to allow a qualified person to apply modifying factors in sufficient detail to support detailed mine planning and final evaluation of the economic viability of the deposit. Because a measured mineral resource has a higher level of confidence than the level of confidence of either an indicated mineral resource or an inferred mineral resource, a measured mineral resource may be converted to a proven mineral reserve or to a probable mineral reserve. |
(10) The term "indicated resources" means that part of a mineral resource for which quantity and grade or quality are estimated on the basis of adequate geological evidence and sampling. The level of geological certainty associated with an indicated mineral resource is sufficient to allow a qualified person to apply modifying factors in sufficient detail to support mine planning and evaluation of the economic viability of the deposit. Because an indicated mineral resource has a lower level of confidence than the level of confidence of a measured mineral resource, an indicated mineral resource may only be converted to a probable mineral reserve. |
(11) The term "inferred resources" means that part of a mineral resource for which quantity and grade or quality are estimated on the basis of limited geological evidence and sampling. The level of geological uncertainty associated with an inferred mineral resource is too high to apply relevant technical and economic factors likely to influence the prospects of economic extraction in a manner useful for evaluation of economic viability. Because an inferred mineral resource has the lowest level of geological confidence of all mineral resources, which prevents the application of the modifying factors in a manner useful for evaluation of economic viability, an inferred mineral resource may not be considered when assessing the economic viability of a mining project, and may not be converted to a mineral reserve. |
(12) Mineral resources are based on $1700/oz gold, $21/oz silver, $1.15/lb lead, $1.35/lb zinc and $3.00/lb copper, unless otherwise stated. |
(13) The resource NSR cut-off values for Greens Creek are $210/ton for all zones except the Gallagher Zone at $215/ton; metallurgical recoveries (actual 2022): 81% for silver, 72% for gold, 82% for lead, and 89% for zinc. |
(14) The resource NSR cut-off values for Lucky Friday are $200.57/ton for the 30 Vein, $227.90/ton for the Intermediate Veins and $198.48/ton for the Lucky Friday Veins; metallurgical recoveries (actual 2022): 95% for silver, 95% for lead, and 88% for zinc. |
(15) The average resource cut-off grades at Casa Berardi are 0.11 oz/ton gold for underground and 0.034 oz/ton gold for open pit; metallurgical recovery (actual 2022): 87% for gold; US$/CAN$ exchange rate: 1:1.3. |
(16) The resource NSR cut-off value at Keno Hill is $129.10/ton (CAN$185/tonne); using minimum width of 4.9 feet (1.5m); metallurgical recovery: 93% for silver, 25% for gold, 93% for lead, 72% for zinc; US$/CAN$ exchange rate: 1:1.3 |
(17) Indicated resources for most zones at San Sebastian based on $1500/oz gold, $21/oz silver, $1.15/lb lead, $1.35/lb zinc and $3.00/lb copper using a cut-off grade of $90.72/ton ($100/tonne); $1700/oz gold used for Toro, Bronco, and Tigre zones. Metallurgical recoveries based on grade dependent recovery curves: recoveries at the mean resource grade average 89% for silver and 84% for gold for oxide material and 85% for silver, 83% for gold, 81% for lead, 86% for zinc, and 83% for copper for sulfide material. Resources reported at a minimum mining width of 8.2 feet (2.5m) for Middle Vein, North Vein, and East Francine, 6.5ft (1.98m) for El Toro, El Bronco, and El Tigre, and 4.9 feet (1.5 m) for Hugh Zone and Andrea. |
(18) Mineral resources for Fire Creek, Hollister and Midas are reported using $1500/oz gold and $21/oz silver prices, unless otherwise noted. A minimum mining width is defined as four feet or the vein true thickness plus two feet, whichever is greater. |
(19) Fire Creek mineral resources are reported at a gold equivalent cut-off grade of 0.283 oz/ton. Metallurgical recoveries: 90% for gold and 70% for silver. |
(20) Hollister mineral resources, including the Hatter Graben are reported at a gold equivalent cut-off grade of 0.238 oz/ton. Metallurgical recoveries: 88% for gold and 66% for silver |
(21) Midas mineral resources are reported at a gold equivalent cut-off grade of 0.237 oz/ton. Metallurgical recoveries: 90% for gold and 70% for silver. A gold-equivalent cut-off grade of 0.1 oz/ton and a gold price of $1700/oz used for Sinter Zone with resources undiluted. |
(22) Measured, indicated and inferred resources at Heva and Hosco are based on $1,500/oz gold. Resources are without dilution or material loss at a gold cut-off grade of 0.01 oz/ton for open pit and 0.088 oz/ton for underground. Metallurgical recovery: Heva: 95% for gold, Hosco: 87.7% for gold. |
(23) Indicated and Inferred resources at the Star property are reported using a minimum mining width of 4.3 feet and an NSR cut-off value of $150/ton; Metallurgical recovery: 93% for silver, 93% for lead, and 87% for zinc. |
(24) Inferred open-pit resources for Fire Creek calculated November 30, 2017 using gold and silver recoveries of 65% and 30% for oxide material and 60% and 25% for mixed oxide-sulfide material. Indicated Resources reclassified as Inferred in 2019. Open pit resources are calculated at $1400 gold and $19.83 silver and cut-off grade of 0.01 Au Equivalent oz/ton and is inclusive of 10% mining dilution and 5% ore loss. Open pit mineral resources exclusive of underground mineral resources. NI43-101 Technical Report for the Fire Creek Project, Lander County, Nevada; Effective Date March 31, 2018; prepared by Practical Mining LLC, Mark Odell, P.E. for Hecla Mining Company, June 28, 2018. |
(25) Inferred resources reported at a minimum mining width of 6.0 feet for Bulldog and an NSR cut-off value of $175/ton and 5.0 feet for Equity and North Amethyst veins at an NSR cut-off value of $100/ton; Metallurgical recoveries based on grade dependent recovery curves; metal recoveries at the mean resource grade average 89% silver, 74% lead, and 81% zinc for the Bulldog and a constant 85% gold and 85% silver for North Amethyst and Equity. |
(26) Inferred resource at Monte Cristo reported at a minimum mining width of 5.0 feet; resources based on $1400 Au, $26.50 Ag using a 0.06 oz/ton gold cut-off grade. Metallurgical recovery: 90% for gold and 90% silver. |
(27) Inferred resource at Rock Creek reported at a minimum thickness of 15 feet and an NSR cut-off value of $24.50/ton; Metallurgical recoveries: 88% for silver and 92% for copper. Resources adjusted based on mining restrictions as defined by U.S. Forest Service, Kootenai National Forest in the June 2003 'Record of Decision, Rock Creek Project'. |
(28) Inferred resource at Montanore reported at a minimum thickness of 15 feet and an NSR cut-off value of $24.50/ton NSR; Metallurgical recoveries: 88% for silver and 92% copper. Resources adjusted based on mining restrictions as defined by U.S. Forest Service, Kootenai National Forest, Montana DEQ in December 2015 'Joint Final EIS, Montanore Project' and the February 2016 U.S Forest Service - Kootenai National Forest 'Record of Decision, Montanore Project'. |
|
Totals may not represent the sum of parts due to rounding |
TABLE B |
||||||||||
Assay Results – Q4 2022 |
||||||||||
Keno Hill (Yukon Territory) |
||||||||||
Zone |
Drill Hole Number |
Drillhole Azm/Incl |
Sample From (feet) |
Sample To (feet) |
True Width (feet) |
Silver (oz/ton) |
Gold (oz/ton) |
Zinc (%) |
Lead (%) |
Depth From Surface (feet) |
Coral-Wigwam |
K-22-0806 |
297/-57 |
513.3 |
514.3 |
0.7 |
6.0 |
0.0 |
0.1 |
0.2 |
-429 |
Coral-Wigwam |
K-22-0809 |
310/-90 |
415.4 |
415.8 |
0.2 |
2.7 |
0.0 |
1.5 |
1.2 |
-415 |
Coral-Wigwam |
K-22-0809 |
310/-90 |
473.9 |
475.6 |
0.8 |
7.5 |
0.0 |
0.1 |
0.1 |
-473 |
Coral-Wigwam |
K-22-0820 |
295/-59 |
1078.7 |
1081.4 |
2.2 |
4.0 |
0.0 |
0.1 |
0.2 |
-915 |
Coral-Wigwam |
K-22-0820 |
295/-59 |
1439.9 |
1442.3 |
1.9 |
1.1 |
0.0 |
0.0 |
0.0 |
-1207 |
Coral Wigwam |
K-22-0825 |
275/-73 |
1520.4 |
1533.6 |
7.3 |
101.5 |
0.0 |
0.1 |
0.1 |
-1291 |
Coral Wigwam |
Including |
1525.6 |
1526.1 |
0.3 |
2522.1 |
0.0 |
0.7 |
0.3 |
-1303 |
|
Coral-Wigwam |
K-22-0828 |
305/-67 |
1249.1 |
1256.6 |
5.0 |
4.9 |
0.0 |
0.4 |
0.3 |
-1146 |
Coral-Wigwam |
K-22-0828 |
305/-67 |
1521.6 |
1525.9 |
3.2 |
2.9 |
0.0 |
0.1 |
0.0 |
-1396 |
Hector Calumet |
K-22-0829 |
342/-67 |
1162.6 |
1193.7 |
24.6 |
5.0 |
0.0 |
0.5 |
1.1 |
-1161 |
Hector Calumet |
Including |
1162.6 |
1175.9 |
10.5 |
9.6 |
0.0 |
0.8 |
2.5 |
-1161 |
|
Hector Calumet |
K-22-0832 |
331/-70 |
1664.0 |
1664.7 |
0.5 |
1.9 |
0.0 |
0.0 |
1.5 |
-1544 |
Hector Calumet |
K-22-0834 |
312/-65 |
923.1 |
938.8 |
11.8 |
10.6 |
0.0 |
2.0 |
1.5 |
-845 |
Hector Calumet |
Including |
923.1 |
929.3 |
4.7 |
21.8 |
0.0 |
2.7 |
2.6 |
-845 |
|
Hector-Calumet |
K-22-0834 |
312/-65 |
1762.1 |
1765.0 |
2.3 |
22.0 |
0.0 |
6.4 |
2.3 |
-1609 |
Hector-Calumet |
Including |
1763.9 |
1765.0 |
0.8 |
41.1 |
0.0 |
7.1 |
1.1 |
-1610 |
|
Hector Calumet |
K-22-0834 |
312/-65 |
1837.3 |
1841.7 |
3.5 |
4.9 |
0.0 |
2.7 |
2.2 |
-1677 |
Hector Calumet |
K-22-0836 |
300/-66 |
1778.6 |
1779.5 |
0.7 |
2.1 |
0.0 |
0.6 |
0.6 |
-1636 |
Hector Calumet |
K-22-0837 |
293/-75 |
1211.0 |
1225.9 |
11.0 |
10.5 |
0.0 |
4.0 |
1.1 |
-1207 |
Hector Calumet |
Including |
1211.0 |
1212.4 |
1.1 |
47.2 |
0.0 |
33.0 |
0.7 |
-1207 |
|
Hector Calumet |
Including |
1223.1 |
1224.1 |
0.7 |
54.0 |
0.0 |
4.6 |
5.7 |
-1219 |
|
Hector Calumet |
K-22-0837 |
293/-75 |
1357.6 |
1361.1 |
2.5 |
1.2 |
0.0 |
0.2 |
0.3 |
-1306 |
Silver King |
K-22-0804 |
153/-51 |
260.9 |
268.1 |
1.9 |
38.8 |
0.0 |
4.7 |
1.4 |
-203 |
Silver King |
Including |
262.5 |
265.3 |
0.7 |
76.1 |
0.0 |
8.1 |
3.2 |
-204 |
|
Silver King |
K-22-0804 |
153/-51 |
324.6 |
326.0 |
0.4 |
1.0 |
0.0 |
0.0 |
0.0 |
-249 |
Silver King |
K-22-0804 |
153/-51 |
526.5 |
531.2 |
1.2 |
1.0 |
0.0 |
0.0 |
0.0 |
-399 |
Silver King |
K-22-0804 |
153/-51 |
557.6 |
561.9 |
1.1 |
1.7 |
0.0 |
0.0 |
0.0 |
-422 |
Silver King |
K-22-0804 |
153/-51 |
935.0 |
936.5 |
0.4 |
1.3 |
0.0 |
1.1 |
0.4 |
-699 |
Silver King |
K-22-0808 |
315/-66 |
332.2 |
347.3 |
12.3 |
2.2 |
0.0 |
1.2 |
0.0 |
-304 |
Silver King |
K-22-0808 |
315/-66 |
360.1 |
361.6 |
1.2 |
1.9 |
0.0 |
0.3 |
0.1 |
-329 |
Silver King |
K-22-0810 |
305-/66.5 |
358.5 |
380.5 |
16.3 |
7.9 |
0.0 |
0.9 |
0.2 |
-325 |
Silver King |
Including |
374.7 |
378.8 |
3.0 |
31.6 |
0.0 |
1.9 |
0.3 |
-339 |
|
Silver King |
K-22-0810 |
305-/66.5 |
389.2 |
405.0 |
11.7 |
19.6 |
0.0 |
0.2 |
0.9 |
-352 |
Silver King |
Including |
389.2 |
394.6 |
4.0 |
52.7 |
0.0 |
0.3 |
2.0 |
-352 |
|
Silver King |
K-22-0810 |
305-/66.5 |
845.5 |
848.6 |
2.5 |
1.4 |
0.0 |
0.0 |
0.0 |
-757 |
Silver King |
K-22-0810 |
305-/66.5 |
859.7 |
861.5 |
1.5 |
4.9 |
0.0 |
0.3 |
0.7 |
-769 |
Silver King |
K-22-0810 |
305-/66.5 |
877.7 |
881.7 |
3.2 |
2.5 |
0.0 |
0.0 |
0.0 |
-785 |
Silver King |
K-22-0810 |
305-/66.5 |
891.1 |
893.9 |
2.2 |
2.0 |
0.0 |
0.0 |
0.0 |
-797 |
Silver King |
K-22-0812 |
300/-71 |
758.8 |
761.9 |
1.8 |
0.9 |
0.0 |
0.1 |
0.2 |
-718 |
Silver King |
K-22-0812 |
300/-71 |
829.4 |
853.0 |
13.5 |
1.1 |
0.0 |
0.4 |
0.2 |
-784 |
Silver King |
K-22-0812 |
300/-71 |
864.6 |
876.0 |
5.5 |
11.0 |
0.0 |
0.0 |
0.8 |
-817 |
Silver King |
Including |
864.6 |
867.6 |
1.4 |
33.1 |
0.0 |
0.0 |
0.1 |
-817 |
|
Silver King |
K-22-0812 |
300/-71 |
964.6 |
981.4 |
10.8 |
2.3 |
0.0 |
0.0 |
0.0 |
-911 |
Silver King |
K-22-0814 |
288/-80 |
862.3 |
944.9 |
37.1 |
1.1 |
0.0 |
0.0 |
0.0 |
-851 |
Silver King |
K-22-0817 |
352/-64 |
365.7 |
369.7 |
3.0 |
5.4 |
0.0 |
0.7 |
0.2 |
-364 |
Silver King |
K-22-0819 |
307/-74 |
569.4 |
582.5 |
7.8 |
5.4 |
0.0 |
0.0 |
1.3 |
-546 |
Silver King |
Including |
569.4 |
570.9 |
0.9 |
42.7 |
0.0 |
0.0 |
11.1 |
-546 |
|
Silver King |
K-22-0819 |
307/-74 |
605.4 |
640.6 |
21.1 |
5.6 |
0.0 |
0.0 |
0.5 |
-580 |
Silver King |
Including |
605.4 |
606.7 |
0.8 |
33.5 |
0.0 |
0.0 |
1.4 |
-580 |
|
Silver Spoon |
K-22-0824 |
306-/57 |
2097.8 |
2100.6 |
2.5 |
6.8 |
0.0 |
0.1 |
1.2 |
-1756 |
Silver Spoon |
Including |
2097.8 |
2098.2 |
0.4 |
35.3 |
0.0 |
0.5 |
7.3 |
-1756 |
|
Silver Spoon |
K-22-0824 |
306-/57 |
2107.8 |
2108.7 |
0.8 |
33.0 |
0.0 |
0.0 |
0.0 |
-1764 |
Silver Spoon |
K-22-0824 |
306-/57 |
2190.6 |
2191.5 |
0.7 |
3.5 |
0.0 |
0.9 |
0.2 |
-1835 |
Silver Spoon |
K-22-0824 |
306-/57 |
2227.3 |
2228.2 |
0.7 |
5.2 |
0.0 |
0.3 |
0.1 |
-1866 |
Silver Spoon |
K-22-0824 |
306-/57 |
2244.7 |
2249.7 |
4.0 |
3.2 |
0.0 |
0.5 |
0.4 |
-1881 |
Silver Spoon |
K-22-0824 |
306-/57 |
2283.5 |
2285.3 |
1.5 |
1.6 |
0.0 |
0.2 |
0.1 |
-1914 |
Silver Spoon |
K-22-0826 |
285/-68 |
2371.4 |
2388.5 |
9.7 |
1.1 |
0.0 |
0.3 |
0.2 |
-2164 |
Greens Creek (Alaska) |
||||||||||
Zone |
Drill Hole Number |
Drill Hole Azm/Dip |
Sample From (feet) |
Sample To (feet) |
Est. True Width (feet) |
Silver (oz/ton) |
Gold (oz/ton) |
Zinc (%) |
Lead (%) |
Depth From Mine Portal (feet) |
200S Exploration |
GC5864 |
61.5/13.6 |
284.0 |
285.0 |
0.9 |
2.7 |
0.05 |
6.7 |
2.1 |
-1226 |
200S Exploration |
GC5879 |
244/-7.2 |
242.0 |
244.2 |
2.2 |
5.0 |
0.01 |
5.6 |
2.8 |
-1331 |
200S Exploration |
GC5879 |
244/-7.2 |
274.8 |
275.8 |
1.0 |
4.3 |
0.04 |
9.8 |
4.1 |
-1337 |
200S Exploration |
GC5883 |
186.9/-49.4 |
517.0 |
521.0 |
3.6 |
15.4 |
0.02 |
0.4 |
0.2 |
-1718 |
200S Definition |
GC5872 |
238.5/-88.6 |
1094.0 |
1099.0 |
2.5 |
29.3 |
0.11 |
1.0 |
0.5 |
-2400 |
200S Definition |
GC5849 |
243.4/-58.1 |
54.5 |
55.5 |
1.0 |
11.3 |
0.01 |
15.0 |
8.5 |
-1348 |
200S Definition |
GC5849 |
243.4/-58.1 |
97.0 |
99.0 |
2.0 |
4.4 |
0.00 |
11.5 |
5.6 |
-1386 |
200S Definition |
GC5849 |
243.4/-58.1 |
133.0 |
136.5 |
3.2 |
1.1 |
0.01 |
10.6 |
4.7 |
-1419 |
200S Definition |
GC5849 |
243.4/-58.1 |
144.0 |
147.0 |
2.8 |
2.1 |
0.03 |
10.6 |
4.0 |
-1427 |
200S Definition |
GC5849 |
243.4/-58.1 |
172.0 |
178.0 |
1.4 |
0.7 |
0.01 |
8.9 |
4.5 |
-1454 |
200S Definition |
GC5849 |
243.4/-58.1 |
214.5 |
215.5 |
0.1 |
1.3 |
0.01 |
9.5 |
5.9 |
-1486 |
200S Definition |
GC5854 |
243.4/-31.2 |
110.0 |
112.0 |
1.9 |
0.9 |
0.00 |
11.1 |
4.5 |
-1359 |
200S Definition |
GC5872 |
238.5/-88.6 |
1509.0 |
1511.0 |
0.9 |
7.1 |
0.12 |
0.8 |
0.4 |
-2817 |
200S Definition |
GC5894 |
227.6/19.2 |
172.7 |
183.0 |
10.3 |
16.0 |
0.23 |
7.5 |
3.6 |
-1711 |
200S Definition |
GC5898 |
260.9/19.7 |
173.0 |
186.0 |
13.0 |
35.0 |
0.56 |
9.2 |
4.5 |
-1708 |
200S Definition |
GC5898 |
260.9/19.7 |
197.0 |
209.0 |
12.0 |
3.0 |
0.05 |
7.7 |
2.2 |
-1702 |
200S Definition |
GC5899 |
265.3/35.4 |
177.5 |
232.0 |
54.4 |
3.4 |
0.03 |
6.5 |
2.8 |
-1658 |
200S Definition |
GC5903 |
272.5/51.6 |
183.5 |
184.5 |
0.9 |
9.3 |
0.07 |
11.7 |
5.3 |
-1624 |
200S Definition |
GC5903 |
272.5/51.6 |
209.0 |
212.0 |
1.8 |
10.8 |
0.04 |
6.9 |
1.3 |
-1598 |
200S Definition |
GC5906 |
285.9/42 |
199.5 |
201.0 |
1.5 |
16.6 |
0.22 |
2.0 |
0.6 |
-1637 |
200S Definition |
GC5906 |
285.9/42 |
217.5 |
226.0 |
8.3 |
12.2 |
0.04 |
5.9 |
2.3 |
-1637 |
200S Definition |
GC5906 |
285.9/42 |
251.0 |
294.8 |
42.9 |
14.4 |
0.10 |
1.2 |
0.6 |
-1637 |
200S Definition |
GC5906 |
285.9/42 |
399.0 |
402.0 |
1.6 |
0.3 |
0.24 |
0.0 |
0.0 |
-1476 |
200S Definition |
GC5910 |
305.4/49.1 |
230.5 |
237.5 |
6.5 |
11.8 |
0.09 |
1.0 |
0.5 |
-1576 |
200S Definition |
GC5910 |
305.4/49.1 |
396.5 |
397.7 |
1.1 |
1.7 |
0.01 |
7.9 |
3.9 |
-1576 |
200S Definition |
GC5918 |
315.3/56.6 |
266.0 |
267.0 |
0.8 |
3.5 |
0.05 |
7.0 |
3.5 |
-1542 |
East Exploration |
GC5847 |
93.3/46.8 |
253.4 |
256.4 |
2.9 |
8.2 |
0.03 |
3.6 |
2.3 |
86 |
East Exploration |
GC5853 |
142.5/27.4 |
362.9 |
365.3 |
2.4 |
14.5 |
0.11 |
7.9 |
4.2 |
73 |
East Exploration |
GC5853 |
142.5/27.4 |
373.9 |
385.0 |
11.0 |
19.3 |
0.02 |
2.9 |
1.9 |
73 |
East Exploration |
GC5857 |
13.4/44.8 |
270.0 |
288.7 |
16.4 |
18.7 |
0.10 |
7.5 |
3.3 |
61 |
East Exploration |
GC5857 |
13.4/44.8 |
333.6 |
338.8 |
4.5 |
7.4 |
0.02 |
15.1 |
8.2 |
61 |
East Definition |
GC5843 |
229/-60.4 |
453.5 |
458.0 |
3.7 |
7.4 |
0.09 |
14.7 |
4.9 |
138 |
East Definition |
GC5848 |
27.9/-59 |
48.0 |
53.0 |
3.0 |
5.7 |
0.21 |
5.6 |
1.1 |
471 |
East Definition |
GC5848 |
27.9/-59 |
84.0 |
85.5 |
0.9 |
30.4 |
0.04 |
27.2 |
1.2 |
471 |
East Definition |
GC5866 |
28.3/-36.8 |
293.0 |
294.0 |
1.0 |
9.2 |
0.04 |
8.0 |
1.7 |
455 |
East Definition |
GC5867 |
36.1/-22.3 |
306.0 |
308.0 |
1.6 |
15.2 |
0.07 |
6.6 |
4.3 |
517 |
East Definition |
GC5868 |
43.6/-39.3 |
260.5 |
261.5 |
1.0 |
10.0 |
0.09 |
9.9 |
1.8 |
451 |
East Definition |
GC5868 |
43.6/-39.3 |
278.5 |
287.5 |
8.8 |
8.1 |
0.07 |
1.4 |
0.6 |
451 |
East Definition |
GC5868 |
43.6/-39.3 |
280.5 |
287.5 |
6.8 |
9.9 |
0.08 |
1.3 |
0.7 |
451 |
East Definition |
GC5870 |
58.5/-32.9 |
297.0 |
299.5 |
2.5 |
15.6 |
0.06 |
26.9 |
13.2 |
470 |
East Definition |
GC5871 |
58.5/-0.2 |
357.0 |
369.0 |
10.9 |
35.3 |
0.25 |
7.6 |
1.6 |
620 |
East Definition |
GC5873 |
32.2/-62.2 |
285.0 |
286.0 |
1.0 |
3.4 |
0.01 |
0.7 |
6.2 |
376 |
East Definition |
GC5877 |
102.1/-35.7 |
346.0 |
348.0 |
2.0 |
8.6 |
0.09 |
12.0 |
2.7 |
430 |
East Definition |
GC5877 |
102.1/-35.7 |
354.0 |
355.0 |
1.0 |
7.7 |
0.15 |
4.0 |
1.0 |
430 |
East Definition |
GC5881 |
86.7/12.6 |
512.5 |
517.0 |
3.0 |
182.6 |
0.16 |
1.2 |
0.4 |
748 |
East Definition |
GC5884 |
68/15.9 |
456.0 |
461.5 |
4.6 |
42.8 |
0.43 |
15.4 |
8.2 |
762 |
East Definition |
GC5885 |
67.8/20.8 |
467.0 |
470.0 |
2.4 |
19.0 |
0.08 |
6.2 |
2.7 |
776 |
East Definition |
GC5889 |
63.4/-16.9 |
459.0 |
460.0 |
0.8 |
7.6 |
0.08 |
15.8 |
8.3 |
493 |
East Definition |
GC5895 |
243.5/-65.2 |
384.5 |
388.0 |
3.5 |
27.1 |
1.01 |
17.7 |
5.3 |
306 |
East Definition |
GC5902 |
63.4/-42.8 |
335.0 |
340.5 |
5.5 |
14.6 |
0.14 |
16.0 |
6.1 |
426 |
East Definition |
GC5904 |
63.4/-21.8 |
306.0 |
312.0 |
6.0 |
8.8 |
0.07 |
3.6 |
1.1 |
532 |
East Definition |
GC5904 |
63.4/-21.8 |
349.0 |
353.5 |
4.5 |
9.5 |
0.05 |
10.7 |
4.4 |
532 |
East Definition |
GC5904 |
63.4/-21.8 |
375.0 |
376.0 |
1.0 |
10.8 |
0.08 |
24.1 |
8.2 |
532 |
East Definition |
GC5905 |
63.4/-7.6 |
385.0 |
389.0 |
3.4 |
9.4 |
0.05 |
11.6 |
5.4 |
613 |
East Definition |
GC5907 |
63.4/13.9 |
523.0 |
530.0 |
4.8 |
16.4 |
0.08 |
10.0 |
2.6 |
786 |
East Definition |
GC5909 |
56.9/0.7 |
416.5 |
421.0 |
4.0 |
26.2 |
0.23 |
10.2 |
3.6 |
673 |
East Definition |
GC5909 |
56.9/0.7 |
441.0 |
451.0 |
8.9 |
10.8 |
0.28 |
23.3 |
8.4 |
673 |
East Definition |
GC5912 |
236.2/-62.2 |
547.0 |
571.5 |
15.8 |
15.9 |
0.10 |
15.6 |
7.7 |
791 |
East Definition |
GC5916 |
52.3/13.9 |
532.0 |
536.0 |
3.2 |
11.2 |
0.22 |
1.7 |
0.5 |
779 |
East Definition |
GC5919 |
45.4/6.2 |
484.5 |
485.5 |
0.8 |
16.1 |
0.13 |
11.3 |
5.0 |
699 |
East Definition |
GC5922 |
47.5/16 |
569.0 |
570.0 |
0.6 |
8.7 |
0.10 |
18.8 |
5.6 |
812 |
East Definition |
GC5923 |
68.9/18.1 |
530.0 |
542.0 |
9.5 |
10.3 |
0.08 |
3.1 |
1.1 |
798 |
East Definition |
GC5925 |
69.4/9.7 |
480.3 |
488.1 |
6.1 |
11.2 |
0.04 |
8.5 |
3.6 |
732 |
East Definition |
GC5927 |
74.7/14.8 |
537.5 |
542.5 |
3.5 |
15.5 |
0.19 |
13.0 |
5.2 |
775 |
East Definition |
GC5928 |
76.1/6.9 |
429.7 |
437.2 |
5.3 |
11.0 |
0.02 |
7.3 |
2.2 |
706 |
East Definition |
GC5928 |
76.1/6.9 |
475.5 |
478.5 |
2.1 |
10.4 |
0.09 |
10.7 |
3.8 |
706 |
East Definition |
GC5928 |
76.1/6.9 |
491.0 |
497.5 |
4.6 |
22.5 |
0.68 |
2.1 |
1.2 |
706 |
SW Definition |
GC5830 |
36/-21.3 |
210.0 |
214.0 |
4.0 |
5.9 |
0.09 |
1.6 |
1.0 |
-865 |
SW Definition |
GC5830 |
36/-21.3 |
326.0 |
338.5 |
12.4 |
5.3 |
0.09 |
14.2 |
4.9 |
-865 |
SW Definition |
GC5841 |
85.4/-22 |
129.0 |
140.0 |
11.0 |
15.4 |
0.05 |
7.7 |
4.9 |
-781 |
SW Definition |
GC5844 |
81.5/-4 |
2.8 |
17.5 |
14.6 |
6.9 |
0.13 |
1.5 |
0.7 |
-730 |
SW Definition |
GC5844 |
81.5/-4 |
165.0 |
172.3 |
6.4 |
42.7 |
0.18 |
7.7 |
3.9 |
-738 |
Upper Plate Exploration |
PS0435 |
284/-75 |
678.0 |
679.0 |
1.0 |
0.4 |
0.00 |
7.5 |
4.9 |
7 |
Upper Plate Exploration |
PS0435 |
284/-75 |
684.0 |
692.0 |
7.9 |
0.4 |
0.01 |
14.1 |
4.3 |
215 |
Upper Plate Exploration |
PS0437 |
185/-57 |
371.0 |
385.5 |
12.6 |
8.9 |
0.14 |
12.1 |
4.8 |
314 |
Upper Plate Exploration |
PS0438 |
201/-52 |
397.1 |
407.9 |
7.6 |
11.9 |
0.17 |
17.3 |
7.8 |
288 |
Upper Plate Exploration |
PS0439 |
63/-51 |
280.0 |
284.0 |
3.5 |
7.9 |
0.01 |
4.2 |
1.8 |
405 |
Upper Plate Exploration |
PS0439 |
63/-51 |
290.4 |
298.8 |
7.3 |
13.0 |
0.00 |
0.7 |
0.4 |
395 |
Upper Plate Exploration |
PS0440 |
48/-87 |
253.0 |
254.0 |
1.0 |
43.9 |
0.01 |
0.0 |
0.0 |
432 |
West Definition |
GC5929 |
63.4/-50.9 |
321.0 |
324.0 |
3.0 |
5.5 |
0.07 |
6.0 |
2.5 |
299 |
West Definition |
GC5929 |
63.4/-50.9 |
329.5 |
331.0 |
1.5 |
9.1 |
0.05 |
3.5 |
1.0 |
299 |
West Definition |
GC5929 |
63.4/-50.9 |
335.0 |
336.0 |
1.0 |
7.8 |
0.08 |
4.7 |
1.2 |
299 |
Casa Berardi (Quebec) |
|||||||
Zone |
Drill Hole Number |
Drill Hole Azm/Dip |
Sample From (feet) |
Sample To (feet) |
True Width (feet) |
Gold (oz/ton) |
Depth From Mine Surface (feet) |
113 Zone |
CBW-1185 |
344/-8 |
683.7 |
695.4 |
9.8 |
0.05 |
3325 |
113 Zone |
CBW-1186 |
336 / 10 |
728.2 |
742.9 |
14.8 |
0.02 |
3124 |
113 Zone |
CBW-1187 |
340 / 25 |
767.8 |
794.1 |
23.6 |
0.05 |
3123 |
113 Zone |
CBW-1188 |
352 / 15 |
747.8 |
756.0 |
7.5 |
0.11 |
3124 |
113 Zone |
CBW-1188 |
352 / 15 |
770.8 |
783.9 |
12.1 |
0.12 |
3125 |
113 Zone |
Including |
777.4 |
783.9 |
6.2 |
0.21 |
3125 |
|
113 Zone |
CBW-1189 |
352 /-1 |
701.9 |
711.8 |
8.5 |
0.10 |
3301 |
113 Zone |
CBW-1189 |
352 /-1 |
724.9 |
738.0 |
12.5 |
0.11 |
3307 |
113 Zone |
Including |
728.2 |
734.7 |
5.6 |
0.18 |
3307 |
|
113 Zone |
CBW-1200 |
349 /-65 |
1628.2 |
1663.0 |
24.3 |
0.06 |
3879 |
113 Zone |
CBW-1201 |
350 /-77 |
1836.1 |
1849.3 |
9.2 |
0.05 |
4252 |
113 Zone |
CBW-1201 |
350 /-77 |
1882.1 |
1891.9 |
6.9 |
0.06 |
4288 |
118 Zone |
CBP-1183 |
12/-52 |
273.9 |
281.1 |
4.9 |
0.05 |
3288 |
118 Zone |
Including |
276.8 |
278.8 |
1.6 |
0.16 |
3288 |
|
118 Zone |
CBP-1184 |
16/-23 |
839.7 |
856.1 |
13.8 |
0.11 |
3398 |
118 Zone |
Including |
846.2 |
849.5 |
2.3 |
0.26 |
3398 |
|
118 Zone |
CBP-1185 |
16/5 |
790.5 |
797.0 |
5.9 |
0.03 |
3080 |
118 Zone |
CBP-1188 |
352/-41 |
269.0 |
278.8 |
8.5 |
0.02 |
3249 |
118 Zone |
CBP-1189 |
349/-60 |
310.3 |
321.4 |
10.5 |
0.12 |
3345 |
118 Zone |
Including |
318.2 |
321.4 |
2.6 |
0.33 |
3350 |
|
118 Zone |
CBP-1190 |
40/-63 |
318.5 |
329.6 |
10.8 |
0.39 |
3359 |
118 Zone |
Including |
325.0 |
326.4 |
1.0 |
3.32 |
3360 |
|
118 Zone |
CBP-1191 |
34/-42 |
267.0 |
279.8 |
12.5 |
0.29 |
3254 |
118 Zone |
Including |
269.9 |
273.2 |
3.0 |
1.14 |
3252 |
|
118 Zone |
CBP-1192 |
50/-39 |
291.3 |
299.8 |
7.9 |
0.09 |
3257 |
118 Zone |
Including |
294.5 |
297.2 |
2.6 |
0.29 |
3257 |
|
118 Zone |
CBP-1193 |
35/3 |
282.1 |
291.9 |
8.9 |
0.03 |
3070 |
118 Zone |
CBP-1194 |
4/-33 |
191.2 |
201.1 |
6.9 |
0.02 |
3180 |
118 Zone |
CBP-1194 |
4/-33 |
191.2 |
201.1 |
8.5 |
0.02 |
3180 |
118 Zone |
CBP-1194 |
4/-33 |
869.2 |
876.7 |
6.9 |
0.09 |
3515 |
119 Zone |
CBP-1218 |
180/30 |
305.0 |
314.9 |
9.5 |
0.05 |
791 |
119 Zone |
Including |
308.3 |
311.6 |
3.0 |
0.15 |
791 |
|
148 Zone |
CBE-0401 |
346 /-23 |
635.7 |
647.1 |
10.5 |
0.02 |
2457 |
148 Zone |
CBE-0402 |
337 /-18 |
602.2 |
629.4 |
25.3 |
0.12 |
2401 |
148 Zone |
CBE-0403 |
337 /-28 |
614.0 |
624.8 |
10.2 |
0.09 |
2491 |
148 Zone |
CBE-0403 |
337 /-28 |
690.4 |
705.9 |
13.8 |
0.18 |
2529 |
148 Zone |
CBE-0404 |
331 /-22 |
634.0 |
646.2 |
10.8 |
0.06 |
2442 |
148 Zone |
CBE-0404 |
331 /-22 |
659.0 |
682.9 |
20.3 |
0.27 |
2455 |
148 Zone |
CBE-0252 |
359 /-47 |
1674.4 |
1685.3 |
7.9 |
0.01 |
2657 |
148 Zone |
CBE-0254 |
10 /-52 |
1664.9 |
1676.7 |
8.5 |
0.01 |
2719 |
152 Zone |
CBE-0255 |
347 /-11 |
1126.0 |
1143.1 |
15.7 |
0.09 |
1828 |
152 Zone |
Including |
1126.0 |
1128.6 |
2.0 |
0.18 |
1826 |
|
152 Zone |
Including |
1133.6 |
1135.9 |
2.0 |
0.40 |
1828 |
|
152 Zone |
CBE-0255 |
347 /-11 |
1168.0 |
1178.2 |
9.5 |
0.03 |
1839 |
152 Zone |
CBE-0256 |
352 /-17 |
1225.1 |
1246.4 |
17.7 |
0.05 |
2022 |
154 Zone |
CBS-22-065 |
351 /-68 |
924.0 |
955.8 |
15.5 |
0.15 |
843 |
154 Zone |
Including |
927.3 |
935.1 |
3.8 |
0.33 |
836 |
|
154 Zone |
Including |
947.9 |
954.2 |
3.0 |
0.22 |
853 |
|
Lower Inter Zone |
CBS-22-061 |
1 /-82 |
5735.1 |
5742.3 |
4.6 |
0.13 |
4859 |
Lower Inter Zone |
Including |
5735.1 |
5736.7 |
1.0 |
0.40 |
4857 |
|
View source version on businesswire.com: https://www.businesswire.com/news/home/20230214005412/en/
Contacts
Anvita M. Patil
Vice President – Investor Relations and Treasurer
Cheryl Turner
Communications Coordinator
800-HECLA91 (800-432-5291)
Investor Relations
Email: hmc-info@hecla-mining.com
Website: www.hecla-mining.com


