Fourth quarter revenue increased 29% year-over-year to $101.0 million
Fourth quarter GAAP operating loss of $26.5 million, non-GAAP operating income of $6.1 million
PagerDuty, Inc. (NYSE: PD), a leader in digital operations management, today announced financial results for the fourth quarter and full year fiscal 2023, ended January 31, 2023.
This press release features multimedia. View the full release here: https://www.businesswire.com/news/home/20230315005778/en/
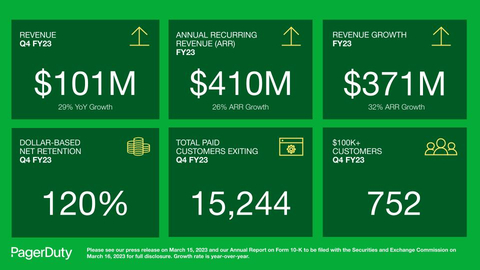
PagerDuty Q4 and FY23 Infographic (Graphic: PagerDuty)
“PagerDuty had another strong year where we grew revenue 32% year-over-year and achieved non-GAAP profitability a year ahead of plan,” said Jennifer Tejada, Chairperson and CEO at PagerDuty. “In Q4 PagerDuty achieved our first-ever $100 million quarter and surpassed $400 million in annual recurring revenue. We continue to combine durable growth with operating margin expansion and innovation.”
Fourth Quarter Fiscal 2023 Financial Highlights
- Revenue was $101.0 million, an increase of 28.6% year over year.
- GAAP operating loss was $26.5 million; GAAP operating margin of (26.2)%.
- Non-GAAP operating income was $6.1 million; non-GAAP operating margin of 6.1%.
- GAAP net loss per share attributable to PagerDuty, Inc. was $0.27; non-GAAP net income per diluted share attributable to PagerDuty, Inc. was $0.08.
- Operating cash flow was $17.6 million, with free cash flow of $15.6 million.
- Cash, cash equivalents and current investments were $477.0 million as of January 31, 2023.
Full Year Fiscal 2023 Financial Highlights
- Revenue was $370.8 million, an increase of 31.8% year over year.
- GAAP operating loss was $129.4 million; GAAP operating margin of (34.9)%.
- Non-GAAP operating income was $3.5 million; non-GAAP operating margin of 0.9%.
- GAAP net loss per share attributable to PagerDuty, Inc. was $1.45; non-GAAP net income per diluted share attributable to PagerDuty, Inc. was $0.07.
- Operating cash flow was $17.0 million, with free cash flow of $8.5 million.
The section titled “Non-GAAP Financial Measures” below contains a description of the non-GAAP financial measures and reconciliations between historical GAAP and non-GAAP information.
Fourth Quarter and Recent Highlights
- Finished the fourth quarter with 15,244 total paid customers as of January 31, 2023, compared to 14,865 in the year ago period.
- Reported 752 customers with annual recurring revenue ("ARR") over $100,000 as of January 31, 2023, compared to 594 in the year ago period.
- Reported 50 customers with ARR over $1,000,000 as of January 31, 2023, compared to 43 in the year ago period.
- Delivered a dollar-based net retention rate of 120% as of January 31, 2023, compared to 124% in the year ago period.
- Reported international revenue of 24% of total revenue for the year ended January 31, 2023, consistent with the year ago period.
- Announced the general availability of PagerDuty Status Pages.
- Announced the availability of PagerDuty for Customer Service in ServiceNow CSM.
- Expanded leadership team with appointment of Jeremy Kmet as Senior Vice President of Global Field Operations.
- Published Third Annual Inclusion, Diversity, & Equity (ID&E) Report.
- Featured case study: BRINKS
- Land and Expands include: Carrefour, IBM, Recruit Holdings, Proofpoint, Trimble and Workday
Financial Outlook
For the first quarter of fiscal 2024, PagerDuty currently expects:
- Total revenue of $102.0 million - $104.0 million, representing a growth rate of 19% - 22% year over year
- Non-GAAP net income per diluted share attributable to PagerDuty, Inc. of $0.09 - $0.10 assuming approximately 104 million shares
For the full fiscal year 2024, PagerDuty currently expects:
- Total revenue of $446.0 million - $452.0 million, representing a growth rate of 20% - 22% year over year
- Non-GAAP net income per diluted share attributable to PagerDuty, Inc. of $0.45 - $0.50 assuming approximately 105 million shares
These statements are forward-looking and actual results may differ materially. Please refer to the Forward-Looking Statements section below for information on the factors that could cause our actual results to differ materially from these forward-looking statements.
PagerDuty has not reconciled its expectations as to non-GAAP net income (loss) per share attributable to PagerDuty, Inc. to GAAP net loss per share attributable to PagerDuty, Inc. because certain items are out of its control or cannot be reasonably predicted. Accordingly, a reconciliation for forward-looking non-GAAP net income (loss) per share is not available without unreasonable effort.
Conference Call Information:
PagerDuty will host a conference call and live webcast for analysts and investors at 2:00 p.m. Pacific Time on March 15, 2023. This news release with the financial results will be accessible from PagerDuty’s website at investor.pagerduty.com prior to the conference call. A live webcast of the conference call will be accessible from the PagerDuty investor relations website at investor.pagerduty.com.
Supplemental Financial and Other Information:
Supplemental financial and other information can be accessed through PagerDuty’s investor relations website at investor.pagerduty.com. PagerDuty uses the investor relations section on its website as the means of complying with its disclosure obligations under Regulation FD. Accordingly, we recommend that investors monitor PagerDuty’s investor relations website in addition to following PagerDuty’s press releases, SEC filings, social media, including PagerDuty’s LinkedIn account (https://www.linkedin.com/company/482819), Twitter account (twitter.com/pagerduty), the Twitter account @jenntejada and Facebook page (facebook.com/pagerduty), and public conference calls and webcasts.
Non-GAAP Financial Measures:
This press release and the accompanying tables contain the following non-GAAP financial measures: non-GAAP gross profit, non-GAAP gross margin, non-GAAP research and development, non-GAAP sales and marketing, non-GAAP general and administrative, non-GAAP operating income (loss), non-GAAP operating margin, non-GAAP net income (loss) attributable to PagerDuty, Inc., non-GAAP net income (loss) per share attributable to PagerDuty, Inc., and free cash flow.
PagerDuty believes that non-GAAP financial measures, when taken collectively, may be helpful to investors because they provide consistency and comparability with past financial performance and can assist in comparisons with other companies, some of which use similar non-GAAP financial measures to supplement their GAAP results. The non-GAAP financial information is presented for supplemental informational purposes only, should not be considered a substitute for financial information presented in accordance with GAAP, and may be different from similarly-titled non-GAAP measures used by other companies.
The principal limitation of these non-GAAP financial measures is that they exclude significant expenses and income that are required by GAAP to be recorded in PagerDuty’s financial statements. In addition, they are subject to inherent limitations as they reflect the exercise of judgment by PagerDuty’s management about which expenses and income are excluded or included in determining these non-GAAP financial measures. A reconciliation is provided below for each historical non-GAAP financial measure to the most directly comparable financial measure presented in accordance with GAAP.
Specifically, PagerDuty excludes the following from its historical and prospective non-GAAP financial measures, as applicable:
Stock-based Compensation: PagerDuty utilizes stock-based compensation to attract and retain employees. It is principally aimed at aligning their interests with those of its stockholders and at long-term retention, rather than to address operational performance for any particular period. As a result, stock-based compensation expenses vary for reasons that are generally unrelated to financial and operational performance in any particular period.
Employer Taxes Related to Employee Stock Transactions: PagerDuty views the amount of employer taxes related to its employee stock transactions as an expense that is dependent on its stock price, employee exercise and other award disposition activity, and other factors that are beyond PagerDuty’s control. As a result, employer taxes related to employee stock transactions vary for reasons that are generally unrelated to financial and operational performance in any particular period.
Amortization of Acquired Intangible Assets: PagerDuty views amortization of acquired intangible assets as items arising from pre-acquisition activities determined at the time of an acquisition. While these intangible assets are evaluated for impairment regularly, amortization of the cost of purchased intangibles is an expense that is not typically affected by operations during any particular period.
Acquisition-Related Expenses: PagerDuty views acquisition-related expenses, such as transaction costs, acquisition-related retention payments, and acquisition-related asset impairment, as events that are not necessarily reflective of operational performance during a period. In particular, PagerDuty believes the consideration of measures that exclude such expenses can assist in the comparison of operational performance in different periods which may or may not include such expenses.
Amortization of Debt Issuance Costs: The imputed interest rate of the Convertible Senior Notes (the "Notes") was approximately 1.93%. This is a result of the debt issuance costs, which reduce the carrying value of the convertible debt instruments. The debt issuance costs are amortized as interest expense. The expense for the amortization of the debt issuance costs is a non-cash item, and we believe the exclusion of this interest expense will provide for a more useful comparison of our operational performance in different periods.
Restructuring costs: PagerDuty views restructuring costs as events that are not necessarily reflective of operational performance during a period. In particular, PagerDuty believes the consideration of measures that exclude such expenses can assist in the comparison of operational performance in different periods which may or may not include such expenses.
Income Tax Effect of Non-GAAP Adjustments: PagerDuty excludes the related income tax effect of the non-GAAP adjustments described above and eliminates the impact of non-recurring and period-specific items, which can vary in size and frequency. In particular, PagerDuty believes the consideration of measures that exclude such impacts can assist in the comparison of operational performance in different periods which may or may not include items such as acquisition-related income tax benefits.
PagerDuty defines non-GAAP gross profit as gross profit adjusted for stock-based compensation expense, employer taxes related to employee stock transactions, amortization of acquired intangible assets, and restructuring costs. PagerDuty defines non-GAAP gross margin as non-GAAP gross profit as a percentage of revenue.
PagerDuty defines non-GAAP operating income (loss) as GAAP loss from operations excluding stock-based compensation expense, employer taxes related to employee stock transactions, amortization of acquired intangible assets, acquisition-related expenses, and restructuring costs. PagerDuty defines non-GAAP net income (loss) attributable to PagerDuty, Inc. (which is used in calculating non-GAAP net income (loss) per share attributable to PagerDuty, Inc.) as GAAP net loss attributable to PagerDuty, Inc. excluding stock-based compensation expense, employer taxes related to employee stock transactions, amortization of debt issuance costs, amortization of acquired intangible assets, acquisition-related expenses, which include transaction costs and acquisition-related retention payments, which are not necessarily reflective of operational performance during a given period, restructuring costs, and the associated tax impact of these items, where applicable. There are a number of limitations related to the use of these non-GAAP measures as compared to GAAP operating loss and net loss, including that the non-GAAP measures exclude stock-based compensation expense, which has been, and will continue to be for the foreseeable future, a significant recurring expense in PagerDuty’s business and an important part of its compensation strategy.
PagerDuty defines free cash flow as net cash provided by (used in) operating activities, less cash used for purchases of property and equipment and capitalized internal-use software costs. In addition to the reasons stated above, PagerDuty believes that free cash flow is useful to investors as a liquidity measure because it measures PagerDuty’s ability to generate or use cash in excess of its capital investments in property and equipment to strengthen its balance sheet and further invest in its business and potential strategic initiatives. PagerDuty uses free cash flow in conjunction with traditional GAAP measures as part of its overall assessment of its liquidity, including the preparation of PagerDuty’s annual operating budget and quarterly forecasts, to evaluate the effectiveness of its business strategies, and to assess its liquidity.
There are a number of limitations related to the use of free cash flow as compared to net cash provided by (used in) operating activities, including that free cash flow includes capital expenditures, the benefits of which are realized in periods subsequent to those when expenditures are made.
PagerDuty encourages investors to review the related GAAP financial measures and the reconciliation of these non-GAAP financial measures to their most directly comparable GAAP financial measures, which it includes in press releases announcing quarterly financial results, including this press release, and not to rely on any single financial measure to evaluate PagerDuty’s business.
Please see the reconciliation tables at the end of this release for the reconciliation of GAAP and non-GAAP results.
Forward-Looking Statements:
This press release contains “forward-looking statements” within the meaning of the “safe harbor” provisions of the Private Securities Litigation Reform Act of 1995, including but not limited to, statements regarding our future financial performance and outlook and market positioning. Words such as “expect,” “extend,” “anticipate,” “should,” “believe,” “hope,” “target,” “project,” “accelerate,” “goals,” “estimate,” “potential,” “predict,” “may,” “will,” “might,” “could,” “intend,” “shall” and variations of these terms or the negative of these terms and similar expressions are intended to identify these forward-looking statements. Forward-looking statements are subject to a number of risks and uncertainties, many of which involve factors or circumstances that are beyond our control. Our actual results could differ materially from those stated or implied in forward-looking statements due to a number of factors, including but not limited to, risks and other factors detailed in our Annual Report on Form 10-K filed with the Securities and Exchange Commission ("SEC") on March 17, 2022 and our Quarterly Reports on Form 10-Qs filed with the SEC on June 3, 2022, September 2, 2022, and December 2, 2022. Additional information will be made available in our Annual Report on Form 10-K for the fiscal year ended January 31, 2023 and other filings and reports that we may file from time to time with the SEC. In particular, the following risks and uncertainties, among others, could cause results to differ materially from those expressed or implied by such forward-looking statements: the effect of uncertainties related to the COVID-19 pandemic on U.S. and global markets, our business, operations, revenue results, cash flow, operating expenses, demand for our solutions, sales cycles, customer retention and our customers’ businesses; our ability to achieve and maintain future profitability; our ability to attract new customers and retain and sell additional functionality and services to our existing customers; our ability to sustain and manage our growth; our dependence on revenue from a single product; our ability to compete effectively in an increasingly competitive market; and general global market, political, economic, and business conditions.
Past performance is not necessarily indicative of future results. The forward-looking statements included in this press release represent our views as of the date of this press release. We anticipate that subsequent events and developments will cause our views to change. We undertake no intention or obligation to update or revise any forward-looking statements, whether as a result of new information, future events or otherwise. These forward-looking statements should not be relied upon as representing our views as of any date subsequent to the date of this press release.
About PagerDuty
PagerDuty, Inc. (NYSE: PD) is a leader in digital operations management. In an always-on world, organizations of all sizes trust PagerDuty to help them deliver a better digital experience to their customers, every time. Teams use PagerDuty to identify issues and opportunities in real time and bring together the right people to fix problems faster and prevent them in the future. Notable customers include Cisco, Genentech, Electronic Arts, Cox Automotive, Shopify, Zoom, DoorDash, and more. To learn more and try PagerDuty for free, visit www.pagerduty.com. Follow our blog and connect with us on Twitter, LinkedIn, YouTube and Facebook. We’re also hiring, visit https://www.pagerduty.com/careers/ to learn more.
PagerDuty, Inc. Consolidated Statements of Operations (in thousands, except per share data) (unaudited) |
|||||||||||||||
|
Three Months Ended January 31, |
|
Year Ended January 31, |
||||||||||||
|
2023 |
|
2022 |
|
2023 |
|
2022 |
||||||||
Revenue |
$ |
100,966 |
|
|
$ |
78,509 |
|
|
$ |
370,793 |
|
|
$ |
281,396 |
|
Cost of revenue(1) |
|
18,344 |
|
|
|
13,928 |
|
|
|
70,434 |
|
|
|
48,361 |
|
Gross profit |
|
82,622 |
|
|
|
64,581 |
|
|
|
300,359 |
|
|
|
233,035 |
|
Operating expenses: |
|
|
|
|
|
|
|
||||||||
Research and development(1) |
|
34,569 |
|
|
|
27,628 |
|
|
|
134,876 |
|
|
|
95,690 |
|
Sales and marketing(1) |
|
52,621 |
|
|
|
43,400 |
|
|
|
195,622 |
|
|
|
161,624 |
|
General and administrative(1) |
|
21,922 |
|
|
|
20,752 |
|
|
|
99,238 |
|
|
|
77,432 |
|
Total operating expenses |
|
109,112 |
|
|
|
91,780 |
|
|
|
429,736 |
|
|
|
334,746 |
|
Loss from operations |
|
(26,490 |
) |
|
|
(27,199 |
) |
|
|
(129,377 |
) |
|
|
(101,711 |
) |
Interest income |
|
2,005 |
|
|
|
640 |
|
|
|
4,765 |
|
|
|
2,946 |
|
Interest expense |
|
(1,361 |
) |
|
|
(1,353 |
) |
|
|
(5,433 |
) |
|
|
(5,398 |
) |
Other income (expense), net |
|
1,307 |
|
|
|
(826 |
) |
|
|
(19 |
) |
|
|
(2,757 |
) |
Loss before (provision for) benefit from income taxes |
|
(24,539 |
) |
|
|
(28,738 |
) |
|
|
(130,064 |
) |
|
|
(106,920 |
) |
(Provision for) benefit from income taxes |
|
(463 |
) |
|
|
(157 |
) |
|
|
839 |
|
|
|
(535 |
) |
Net loss |
$ |
(25,002 |
) |
|
$ |
(28,895 |
) |
|
$ |
(129,225 |
) |
|
$ |
(107,455 |
) |
Net loss attributable to redeemable non-controlling interest |
|
(440 |
) |
|
|
— |
|
|
|
(802 |
) |
|
|
— |
|
Net loss attributable to PagerDuty, Inc. |
|
(24,562 |
) |
|
|
(28,895 |
) |
|
|
(128,423 |
) |
|
|
(107,455 |
) |
Net loss per share, basic and diluted, attributable to PagerDuty, Inc. |
$ |
(0.27 |
) |
|
$ |
(0.34 |
) |
|
$ |
(1.45 |
) |
|
$ |
(1.27 |
) |
Weighted-average shares used in calculating net loss per share, basic and diluted |
|
90,269 |
|
|
|
86,101 |
|
|
|
88,721 |
|
|
|
84,514 |
|
(1) Includes stock-based compensation expense as follows: |
|||||||||||
|
Three Months Ended January 31, |
|
Year Ended January 31, |
||||||||
|
2023 |
|
2022 |
|
2023 |
|
2022 |
||||
Cost of revenue |
$ |
1,879 |
|
$ |
1,191 |
|
$ |
6,827 |
|
$ |
3,751 |
Research and development |
|
8,946 |
|
|
7,534 |
|
|
39,012 |
|
|
23,764 |
Sales and marketing |
|
7,271 |
|
|
6,051 |
|
|
29,804 |
|
|
19,012 |
General and administrative |
|
5,333 |
|
|
7,391 |
|
|
34,264 |
|
|
23,506 |
Total |
$ |
23,429 |
|
$ |
22,167 |
|
$ |
109,907 |
|
$ |
70,033 |
PagerDuty, Inc. Consolidated Balance Sheets (in thousands) |
|||||||
|
As of January 31, |
||||||
|
2023 |
|
2022 |
||||
|
(unaudited) |
|
|
||||
Assets |
|
|
|
||||
Current assets: |
|
|
|
||||
Cash and cash equivalents |
$ |
274,019 |
|
|
$ |
349,785 |
|
Investments |
|
202,948 |
|
|
|
193,571 |
|
Accounts receivable, net of allowance for credit losses of $2,014 and $1,809 as of January 31, 2023 and January 31, 2022, respectively |
|
91,345 |
|
|
|
75,279 |
|
Deferred contract costs, current |
|
18,674 |
|
|
|
16,672 |
|
Prepaid expenses and other current assets |
|
13,350 |
|
|
|
9,777 |
|
Total current assets |
|
600,336 |
|
|
|
645,084 |
|
Property and equipment, net |
|
18,390 |
|
|
|
18,229 |
|
Deferred contract costs, non-current |
|
27,715 |
|
|
|
26,159 |
|
Lease right-of-use assets |
|
13,982 |
|
|
|
20,227 |
|
Goodwill |
|
118,862 |
|
|
|
72,126 |
|
Intangible assets, net |
|
37,224 |
|
|
|
23,133 |
|
Other assets |
|
1,364 |
|
|
|
1,490 |
|
Total assets |
$ |
817,873 |
|
|
$ |
806,448 |
|
Liabilities and stockholders’ equity |
|
|
|
||||
Current liabilities: |
|
|
|
||||
Accounts payable |
$ |
7,398 |
|
|
$ |
9,505 |
|
Accrued expenses and other current liabilities |
|
11,804 |
|
|
|
13,640 |
|
Accrued compensation |
|
41,834 |
|
|
|
35,327 |
|
Deferred revenue, current |
|
204,137 |
|
|
|
162,881 |
|
Lease liabilities, current |
|
5,904 |
|
|
|
5,637 |
|
Total current liabilities |
|
271,077 |
|
|
|
226,990 |
|
Convertible senior notes, net |
|
282,908 |
|
|
|
281,069 |
|
Deferred revenue, non-current |
|
4,914 |
|
|
|
7,343 |
|
Lease liabilities, non-current |
|
12,704 |
|
|
|
20,912 |
|
Other liabilities |
|
4,184 |
|
|
|
3,159 |
|
Total liabilities |
|
575,787 |
|
|
|
539,473 |
|
Redeemable non-controlling interest |
|
1,108 |
|
|
|
— |
|
Stockholders’ equity: |
|
|
|
||||
Common stock |
|
— |
|
|
|
— |
|
Additional paid-in-capital |
|
719,816 |
|
|
|
616,467 |
|
Accumulated other comprehensive loss |
|
(1,592 |
) |
|
|
(669 |
) |
Accumulated deficit |
|
(477,246 |
) |
|
|
(348,823 |
) |
Total stockholders’ equity |
|
240,978 |
|
|
|
266,975 |
|
Total liabilities, redeemable non-controlling interest, and stockholders’ equity |
$ |
817,873 |
|
|
$ |
806,448 |
|
PagerDuty, Inc. Consolidated Statements of Cash Flows (in thousands) (unaudited) |
|||||||||||||||
|
Three Months Ended January 31, |
|
Year Ended January 31, |
||||||||||||
|
2023 |
|
2022 |
|
2023 |
|
2022 |
||||||||
Cash flows from operating activities |
|
|
|
|
|
|
|
||||||||
Net loss attributable to PagerDuty, Inc. |
|
(24,562 |
) |
|
|
(28,895 |
) |
|
|
(128,423 |
) |
|
|
(107,455 |
) |
Net loss attributable to redeemable non-controlling interest |
|
(440 |
) |
|
|
— |
|
|
|
(802 |
) |
|
|
— |
|
Net loss |
$ |
(25,002 |
) |
|
$ |
(28,895 |
) |
|
$ |
(129,225 |
) |
|
$ |
(107,455 |
) |
Adjustments to reconcile net loss to net cash provided by (used in) operating activities: |
|
|
|
|
|
|
|
||||||||
Depreciation and amortization |
|
4,651 |
|
|
|
2,196 |
|
|
|
17,429 |
|
|
|
8,356 |
|
Amortization of deferred contract costs |
|
5,069 |
|
|
|
4,272 |
|
|
|
19,247 |
|
|
|
14,923 |
|
Amortization of debt issuance costs |
|
463 |
|
|
|
455 |
|
|
|
1,839 |
|
|
|
1,805 |
|
Stock-based compensation |
|
23,429 |
|
|
|
22,167 |
|
|
|
109,907 |
|
|
|
70,033 |
|
Non-cash lease expense |
|
1,160 |
|
|
|
1,133 |
|
|
|
4,073 |
|
|
|
4,464 |
|
Tax benefit related to release of valuation allowance |
|
— |
|
|
|
— |
|
|
|
(1,330 |
) |
|
|
— |
|
Other |
|
155 |
|
|
|
1,178 |
|
|
|
1,841 |
|
|
|
3,770 |
|
Changes in operating assets and liabilities: |
|
|
|
|
|
|
|
||||||||
Accounts receivable |
|
(19,634 |
) |
|
|
(21,954 |
) |
|
|
(16,586 |
) |
|
|
(21,594 |
) |
Deferred contract costs |
|
(6,482 |
) |
|
|
(9,325 |
) |
|
|
(22,805 |
) |
|
|
(26,167 |
) |
Prepaid expenses and other assets |
|
91 |
|
|
|
2,136 |
|
|
|
(2,843 |
) |
|
|
1,279 |
|
Accounts payable |
|
(356 |
) |
|
|
(935 |
) |
|
|
(1,473 |
) |
|
|
2,901 |
|
Accrued expenses and other liabilities |
|
(94 |
) |
|
|
(20 |
) |
|
|
(1,444 |
) |
|
|
(99 |
) |
Accrued compensation |
|
6,771 |
|
|
|
3,006 |
|
|
|
6,147 |
|
|
|
6,766 |
|
Deferred revenue |
|
29,336 |
|
|
|
27,374 |
|
|
|
37,971 |
|
|
|
40,252 |
|
Lease liabilities |
|
(1,985 |
) |
|
|
(1,443 |
) |
|
|
(5,768 |
) |
|
|
(5,255 |
) |
Net cash provided by (used in) operating activities |
|
17,572 |
|
|
|
1,345 |
|
|
|
16,980 |
|
|
|
(6,021 |
) |
Cash flows from investing activities |
|
|
|
|
|
|
|
||||||||
Purchases of property and equipment |
|
(882 |
) |
|
|
(2,081 |
) |
|
|
(4,637 |
) |
|
|
(3,457 |
) |
Capitalization of internal-use software costs |
|
(1,111 |
) |
|
|
(652 |
) |
|
|
(3,836 |
) |
|
|
(3,353 |
) |
Business acquisitions, net of cash acquired |
|
— |
|
|
|
— |
|
|
|
(66,262 |
) |
|
|
(160 |
) |
Asset acquisition |
|
— |
|
|
|
— |
|
|
|
(1,845 |
) |
|
|
— |
|
Purchases of available-for-sale investments |
|
(56,900 |
) |
|
|
(46,485 |
) |
|
|
(212,210 |
) |
|
|
(197,093 |
) |
Proceeds from maturities of available-for-sale investments |
|
53,000 |
|
|
|
37,443 |
|
|
|
202,625 |
|
|
|
194,059 |
|
Proceeds from sales of available-for-sale investments |
|
— |
|
|
|
— |
|
|
|
— |
|
|
|
27,380 |
|
Net cash (used in) provided by investing activities |
|
(5,893 |
) |
|
|
(11,775 |
) |
|
|
(86,165 |
) |
|
|
17,376 |
|
Cash flows from financing activities |
|
|
|
|
|
|
|
||||||||
Investment from redeemable non-controlling interest holder |
|
— |
|
|
|
— |
|
|
|
1,908 |
|
|
|
— |
|
Proceeds from employee stock purchase plan |
|
4,139 |
|
|
|
2,853 |
|
|
|
9,875 |
|
|
|
7,742 |
|
Proceeds from issuance of common stock upon exercise of stock options |
|
2,022 |
|
|
|
2,591 |
|
|
|
10,481 |
|
|
|
15,108 |
|
Employee payroll taxes paid related to net share settlement of restricted stock units |
|
(6,490 |
) |
|
|
(4,967 |
) |
|
|
(28,677 |
) |
|
|
(23,586 |
) |
Net cash (used in) provided by financing activities |
|
(329 |
) |
|
|
477 |
|
|
|
(6,413 |
) |
|
|
(736 |
) |
Effects of foreign currency exchange rates on cash, cash equivalents, and restricted cash |
|
336 |
|
|
|
— |
|
|
|
(168 |
) |
|
|
— |
|
Net increase (decrease) in cash, cash equivalents, and restricted cash |
|
11,686 |
|
|
|
(9,953 |
) |
|
|
(75,766 |
) |
|
|
10,619 |
|
Cash, cash equivalents, and restricted cash at beginning of period |
|
262,333 |
|
|
|
359,738 |
|
|
|
349,785 |
|
|
|
339,166 |
|
Cash, cash equivalents, and restricted cash at end of period |
$ |
274,019 |
|
|
$ |
349,785 |
|
|
$ |
274,019 |
|
|
$ |
349,785 |
|
PagerDuty, Inc. Reconciliation of GAAP to Non-GAAP Financial Measures (in thousands, except percentages) (unaudited) |
|||||||||||||||
|
Three Months Ended January 31, |
|
Year Ended January 31, |
||||||||||||
|
2023 |
|
2022 |
|
2023 |
|
2022 |
||||||||
Reconciliation of gross profit and gross margin |
|
|
|
|
|
|
|
||||||||
GAAP gross profit |
$ |
82,622 |
|
|
$ |
64,581 |
|
|
$ |
300,359 |
|
|
$ |
233,035 |
|
Plus: Stock-based compensation |
|
1,879 |
|
|
|
1,191 |
|
|
$ |
6,827 |
|
|
$ |
3,751 |
|
Plus: Employer taxes related to employee stock transactions |
|
84 |
|
|
|
53 |
|
|
|
163 |
|
|
|
131 |
|
Plus: Amortization of acquired intangible assets |
|
2,087 |
|
|
|
280 |
|
|
|
7,401 |
|
|
|
1,120 |
|
Plus: Restructuring costs |
|
357 |
|
|
|
— |
|
|
|
357 |
|
|
|
— |
|
Non-GAAP gross profit |
$ |
87,029 |
|
|
$ |
66,105 |
|
|
$ |
315,107 |
|
|
$ |
238,037 |
|
GAAP gross margin |
|
81.8 |
% |
|
|
82.3 |
% |
|
|
81.0 |
% |
|
|
82.8 |
% |
Non-GAAP adjustments |
|
4.4 |
% |
|
|
1.9 |
% |
|
|
4.0 |
% |
|
|
1.8 |
% |
Non-GAAP gross margin |
|
86.2 |
% |
|
|
84.2 |
% |
|
|
85.0 |
% |
|
|
84.6 |
% |
|
|
|
|
|
|
|
|
||||||||
Reconciliation of operating expenses |
|
|
|
|
|
|
|
||||||||
GAAP research and development |
$ |
34,569 |
|
|
$ |
27,628 |
|
|
$ |
134,876 |
|
|
$ |
95,690 |
|
Less: Stock-based compensation |
|
(8,946 |
) |
|
|
(7,534 |
) |
|
$ |
(39,012 |
) |
|
$ |
(23,764 |
) |
Less: Employer taxes related to employee stock transactions |
|
(383 |
) |
|
|
(311 |
) |
|
|
(942 |
) |
|
|
(929 |
) |
Less: Acquisition-related expenses |
|
(5 |
) |
|
|
(441 |
) |
|
|
(3,105 |
) |
|
|
(1,789 |
) |
Less: Amortization of acquired intangible assets |
|
(87 |
) |
|
|
— |
|
|
|
(232 |
) |
|
|
— |
|
Less: Restructuring costs |
|
(2,004 |
) |
|
|
— |
|
|
|
(2,004 |
) |
|
|
— |
|
Non-GAAP research and development |
$ |
23,144 |
|
|
$ |
19,342 |
|
|
$ |
89,581 |
|
|
$ |
69,208 |
|
|
|
|
|
|
|
|
|
||||||||
GAAP sales and marketing |
$ |
52,621 |
|
|
$ |
43,400 |
|
|
$ |
195,622 |
|
|
$ |
161,624 |
|
Less: Stock-based compensation |
|
(7,271 |
) |
|
|
(6,051 |
) |
|
|
(29,804 |
) |
|
|
(19,012 |
) |
Less: Employer taxes related to employee stock transactions |
|
(424 |
) |
|
|
(232 |
) |
|
|
(892 |
) |
|
|
(765 |
) |
Less: Amortization of acquired intangible assets |
|
(610 |
) |
|
|
(595 |
) |
|
|
(2,546 |
) |
|
|
(2,380 |
) |
Less: Restructuring costs |
|
(2,200 |
) |
|
|
— |
|
|
|
(2,200 |
) |
|
|
— |
|
Non-GAAP sales and marketing |
$ |
42,116 |
|
|
$ |
36,522 |
|
|
$ |
160,180 |
|
|
$ |
139,467 |
|
|
|
|
|
|
|
|
|
||||||||
GAAP general and administrative |
$ |
21,922 |
|
|
$ |
20,752 |
|
|
$ |
99,238 |
|
|
$ |
77,432 |
|
Less: Stock-based compensation |
|
(5,333 |
) |
|
|
(7,391 |
) |
|
|
(34,264 |
) |
|
|
(23,506 |
) |
Less: Employer taxes related to employee stock transactions |
|
(449 |
) |
|
|
(335 |
) |
|
|
(1,099 |
) |
|
|
(1,192 |
) |
Less: Acquisition-related expenses |
|
— |
|
|
|
(311 |
) |
|
|
(1,454 |
) |
|
|
(319 |
) |
Less: Amortization of acquired intangible assets |
|
(22 |
) |
|
|
— |
|
|
|
(58 |
) |
|
|
— |
|
Less: Restructuring costs |
|
(474 |
) |
|
|
— |
|
|
|
(474 |
) |
|
|
— |
|
Non-GAAP general and administrative |
$ |
15,644 |
|
|
$ |
12,715 |
|
|
$ |
61,889 |
|
|
$ |
52,415 |
|
PagerDuty, Inc. Reconciliation of GAAP to Non-GAAP Financial Measures (in thousands, except percentages and per share data) (unaudited) |
|||||||||||||||
|
Three Months Ended January 31, |
|
Year Ended January 31, |
||||||||||||
|
2023 |
|
2022 |
|
2023 |
|
2022 |
||||||||
Reconciliation of operating income (loss) and operating margin |
|
|
|
|
|
|
|
||||||||
GAAP operating loss |
$ |
(26,490 |
) |
|
$ |
(27,199 |
) |
|
$ |
(129,377 |
) |
|
$ |
(101,711 |
) |
Plus: Stock-based compensation |
|
23,429 |
|
|
|
22,167 |
|
|
|
109,907 |
|
|
|
70,033 |
|
Plus: Employer taxes related to employee stock transactions |
|
1,340 |
|
|
|
931 |
|
|
|
3,096 |
|
|
|
3,017 |
|
Plus: Amortization of acquired intangible assets |
|
2,806 |
|
|
|
875 |
|
|
|
10,237 |
|
|
|
3,500 |
|
Plus: Acquisition-related expenses |
|
5 |
|
|
|
752 |
|
|
|
4,559 |
|
|
|
2,108 |
|
Plus: Restructuring costs |
|
5,035 |
|
|
|
— |
|
|
|
5,035 |
|
|
|
— |
|
Non-GAAP operating income (loss) |
$ |
6,125 |
|
|
$ |
(2,474 |
) |
|
$ |
3,457 |
|
|
$ |
(23,053 |
) |
GAAP operating margin |
|
(26.2 |
) % |
|
|
(34.6 |
) % |
|
|
(34.9 |
) % |
|
|
(36.1 |
) % |
Non-GAAP adjustments |
|
32.3 |
% |
|
|
31.4 |
% |
|
|
35.8 |
% |
|
|
27.9 |
% |
Non-GAAP operating margin |
|
6.1 |
% |
|
|
(3.2 |
) % |
|
|
0.9 |
% |
|
|
(8.2 |
) % |
|
|
|
|
|
|
|
|
||||||||
Reconciliation of net income (loss) |
|
|
|
|
|
|
|
||||||||
GAAP net loss attributable to PagerDuty, Inc. |
$ |
(24,562 |
) |
|
$ |
(28,895 |
) |
|
$ |
(128,423 |
) |
|
$ |
(107,455 |
) |
Plus: Stock-based compensation |
|
23,429 |
|
|
|
22,167 |
|
|
|
109,907 |
|
|
|
70,033 |
|
Plus: Employer taxes related to employee stock transactions |
|
1,340 |
|
|
|
931 |
|
|
|
3,096 |
|
|
|
3,017 |
|
Plus: Amortization of debt issuance costs |
|
463 |
|
|
|
455 |
|
|
|
1,839 |
|
|
|
1,805 |
|
Plus: Amortization of acquired intangible assets |
|
2,806 |
|
|
|
875 |
|
|
|
10,237 |
|
|
|
3,500 |
|
Plus: Acquisition-related expenses |
|
5 |
|
|
|
752 |
|
|
|
4,559 |
|
|
|
2,108 |
|
Plus: Restructuring costs |
|
5,035 |
|
|
|
— |
|
|
|
5,035 |
|
|
|
— |
|
Plus: Income tax effect of non-GAAP adjustments |
|
(1,226 |
) |
|
|
— |
|
|
|
(2,556 |
) |
|
|
— |
|
Non-GAAP net income (loss) attributable to PagerDuty, Inc. |
$ |
7,290 |
|
|
$ |
(3,715 |
) |
|
$ |
3,694 |
|
|
$ |
(26,992 |
) |
|
|
|
|
|
|
|
|
||||||||
Reconciliation of net income (loss) per share, basic |
|
|
|
|
|
|
|
||||||||
GAAP net loss per share, basic, attributable to PagerDuty, Inc. |
$ |
(0.27 |
) |
|
$ |
(0.34 |
) |
|
$ |
(1.45 |
) |
|
$ |
(1.27 |
) |
Non-GAAP adjustments to net loss attributable to PagerDuty, Inc. |
|
0.35 |
|
|
|
0.30 |
|
|
|
1.49 |
|
|
|
0.95 |
|
Non-GAAP net income (loss) per share, basic, attributable to PagerDuty, Inc. |
$ |
0.08 |
|
|
$ |
(0.04 |
) |
|
$ |
0.04 |
|
|
$ |
(0.32 |
) |
|
|
|
|
|
|
|
|
||||||||
Reconciliation of net income (loss) per share, diluted(1) |
|
|
|
|
|
|
|
||||||||
GAAP net loss per share, diluted, attributable to PagerDuty, Inc. |
$ |
(0.27 |
) |
|
$ |
(0.34 |
) |
|
$ |
(1.45 |
) |
|
$ |
(1.27 |
) |
Non-GAAP adjustments to net loss attributable to PagerDuty, Inc. |
|
0.35 |
|
|
|
0.30 |
|
|
|
1.52 |
|
|
|
0.95 |
|
Non-GAAP net income (loss) per share, diluted, attributable to PagerDuty, Inc. |
$ |
0.08 |
|
|
$ |
(0.04 |
) |
|
$ |
0.07 |
|
|
$ |
(0.32 |
) |
|
|
|
|
|
|
|
|
||||||||
Weighted-average shares used in calculating GAAP net loss per share, basic and diluted |
|
90,269 |
|
|
|
86,101 |
|
|
|
88,721 |
|
|
|
84,514 |
|
|
|
|
|
|
|
|
|
||||||||
Weighted-average shares used in calculating non-GAAP net income (loss) per share |
|
|
|
|
|
|
|
||||||||
Basic |
|
90,269 |
|
|
|
86,101 |
|
|
|
88,721 |
|
|
|
84,514 |
|
Diluted |
|
101,747 |
|
|
|
86,101 |
|
|
|
100,862 |
|
|
|
84,514 |
|
Note: Certain figures may not sum due to rounding.
(1) The company uses the if-converted method to calculate the non-GAAP net income per diluted share attributable to PagerDuty, Inc. related to the convertible notes. Approximately 7.2 million shares related to the convertible notes were therefore included in the non-GAAP diluted share number, while the numerator used to compute this measure was increased by $0.9 million and $3.6 million for after-tax interest expense savings related to our convertible notes for the three and twelve months ended January 31, 2023.
PagerDuty, Inc. Reconciliation of GAAP to Non-GAAP Financial Measures (in thousands, except percentages and per share data) (unaudited) |
|||||||||||||||
Free Cash Flow |
|||||||||||||||
|
Three Months Ended January 31, |
|
Year Ended January 31, |
||||||||||||
|
2023 |
|
2022 |
|
2023 |
|
2022 |
||||||||
Net cash provided by (used in) operating activities |
$ |
17,572 |
|
|
$ |
1,345 |
|
|
$ |
16,980 |
|
|
$ |
(6,021 |
) |
Less: |
|
|
|
|
|
|
|
||||||||
Purchases of property and equipment |
|
(882 |
) |
|
|
(2,081 |
) |
|
|
(4,637 |
) |
|
|
(3,457 |
) |
Capitalization of internal-use software costs |
|
(1,111 |
) |
|
|
(652 |
) |
|
|
(3,836 |
) |
|
|
(3,353 |
) |
Free cash flow |
$ |
15,579 |
|
|
$ |
(1,388 |
) |
|
$ |
8,507 |
|
|
$ |
(12,831 |
) |
Net cash (used in) provided by investing activities |
$ |
(5,893 |
) |
|
$ |
(11,775 |
) |
|
$ |
(86,165 |
) |
|
$ |
17,376 |
|
Net cash (used in) provided by financing activities |
$ |
(329 |
) |
|
$ |
477 |
|
|
$ |
(6,413 |
) |
|
$ |
(736 |
) |
Free cash flow margin |
|
15.4 |
% |
|
|
(1.8 |
) % |
|
|
2.3 |
% |
|
|
(4.6 |
) % |
View source version on businesswire.com: https://www.businesswire.com/news/home/20230315005778/en/
Contacts
Investor Relations Contact:
Tony Righetti
investor@pagerduty.com
SOURCE PagerDuty


