Contango ORE, Inc. (“Contango,” “CORE” or the “Company”) (NYSE American: CTGO) announced that it has filed an initial Technical Report Summary (“TRS”) detailing the gold resources at the Lucky Shot Project located near Willow, Alaska. The mineral resource estimates held by Contango at the Lucky Shot Project, effective as of May 26, 2023 comprise Indicated mineral resource estimates of 226,963 tonnes grading 14.5 g/t Au for 105,620 oz Au and Inferred mineral resource estimates of 82,058 tonnes grading 9.5 g/t Au for 25,110 oz Au (see Tables 1 to 3). Estimation sensitivities were run at various capping levels as a check of the appropriateness of loss in total metal content for gold at incrementally lower and higher capping levels. An uncapped gold estimate within the resource shapes produces roughly 30 to 38% more total gold metal globally for both the Lucky Shot and Coleman segments of the Lucky Shot vein (Table 4). The capping level used might have resulted in a higher metal loss than normal (~10%), but this conservative approach was taken due to the extreme grades in some areas and the need to restrict them spatially. In the interest of caution at this stage of the project, the decision was made to use a conservative capping strategy in the current estimation process. With more data, a different approach may be taken. Figure 1 shows the gold composites vs gold estimation for the Coleman segment which has far more drilling than the Lucky Shot segment. The image shows a clear ore shoot geometry that can be used to guide future drilling. The deposits remain open with excellent exploration potential beyond the current mineral resources. As the area in general is underexplored, there is good potential to delineate additional exploration targets on the Lucky Shot Project lease.
This press release features multimedia. View the full release here: https://www.businesswire.com/news/home/20230611291179/en/
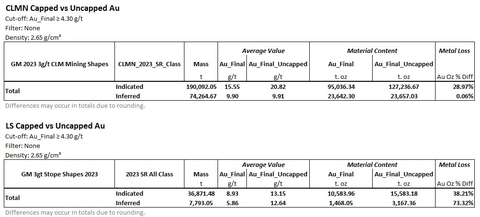
TABLE 4 GLOBAL COMPARISON OF UNCAPPED VS. CAPPED ID3 BLOCK MODELS (Graphic: Business Wire)
Rick Van Nieuwenhuyse, President, and CEO said: “We are indeed excited to report an initial resource at the Lucky Shot Project. What is most important for investors to understand is that when proper drill spacing is achieved, the average indicated grade of the deposit is over 15g/t or nearly half an ounce per ton. Our QP believes that further infill drilling will be able to convert indicated to measured resources and inferred to indicated resources. The current drill spacing, on the Lucky Shot segment in particular, is not dense enough to result in a substantial amount of indicated resources, but future drilling is planned to convert much of the reported inferred to indicated resources in 2023. Now that we have completed access to the downdip projection of the Lucky Shot vein exploration area via the expanded Enserch Tunnel, we will be able to accomplish more detailed infill drilling to define better quality resources. At the Coleman segment, where the drill density is much higher (146 holes versus only 35 at Lucky Shot – see Figures 2 through 5), the QP was unable to justify a measured category (though supported by variography) because Contango did not drill these holes. Our QP recommended a few infill holes to confirm previously drilled areas of the Coleman segment of the vein. One other area of upside refers to the amount of coarse free gold and capping strategy. The current conservative capping strategy reduces global gold content by over 30% compared to uncapped grades (see Table 4). More drilling - particularly in the areas of the higher-grade ore shoots evident in the grade-thickness model (see Figure 1), and bulk sampling of the vein material will assist in a better understanding of grade definition – including a renewed look at the capping strategy. We are very pleased with this initial resource at Lucky Shot and are planning a follow-up surface and underground drill program to augment resources sufficient to begin mine planning.”
For more context, please join CEO Rick Van Nieuwenhuyse in a live event on June 15th at 12pm EST/9am PST. Q&A will follow a brief presentation. Click here to register: https://events.6ix.com/preview/6484d8e796a68cd2152d5f39
ABOUT THE LUCKY SHOT VEIN
The Lucky Shot vein is hosted within a shear zone in medium to coarse grained granodiorite intrusive rock. The granodiorite country rock is normally very competent and stands well underground. The shear zone ranges from 1 to 5 meters (3 to 15 feet) thick and hosts one or more brecciated and sheared quartz veins containing sulfides and fine free gold. Individual quartz veins can be 30 cm (1ft) to over 3 meters thick with associated silicified and stockwork mineralized zones. The Lucky Shot vein is offset along northwest striking and northeast dipping faults that sub-divide the vein structure into segments referred to in the TRS as the Lucky Shot segment and the Coleman segment. The Company completed a total of 3,816 meters (12,519 feet) of underground drilling in 29 HQ drill holes from the Enserch tunnel (see Figures 2, 4, 5 and 6, and Table 5 for location and results). The quartz vein and associated silicified shear zone have elevated very fine grained dark grey sulfides (sulfosalt and telluride mineral species) and medium to coarse grained pyrite. Detailed mineralogic studies are underway. Samples have been taken from vein material as well the immediate footwall and hanging wall of the vein structure.
Gold was discovered in the Lucky Shot area in 1918, with subsequent mining from 1922 to 1942. The Willow Creek mining district historically produced 19 metric tonnes or approximately 610,874 troy ounces of gold from ore ranging between 30 and 60g/t making it the third largest historic lode gold producing district in Alaska (Harlan, et al., 2017). The Lucky Shot mine itself produced a reported 252,000 oz from 169,000 tons of free-milling ore indicating an average head grade of 40 g/t (1.6 oz/tonne) (Stoll, 1997), with additional minor production from the Coleman and War Baby mines. The Company has not undertaken any independent work to verify or confirm the previously reported information (Harlan, et al., 2017 and Stoll, 1997). The historical information may not be representative of future results of the Company’s activities.
ABOUT THE S-K 1300 TECHNICAL REPORT
The TRS on the Lucky Shot Project as of May 26, 2023 was prepared by Sims Resources LLC ("SR"). John Sims, C.P.G., with SR, is the qualified person ("QP") who authored the TRS in accordance with Item 1302 of subpart 1300 of Regulation S-K (“S-K 1300”). The TRS was prepared in compliance with Item 601(b)(96) of Regulation S-K and S-K 1300 and mineral resource estimates have been classified in accordance with the definitions for mineral resources in S-K 1300. The mineral resource estimates were developed using a computer-based block model based on drill hole assay information available through February 2023 and geologic interpretation of the mineralization boundaries. Mineral resources were estimated using the block model and underground shapes created in Leapfrog software at a 3.0 g/t Au cutoff grade to establish the areas of the deposit with reasonable prospects for economic extraction. The mineral resources are contained within two deposits: Lucky Shot and Coleman. The Lucky Shot and Coleman mineralization was modeled incorporating structural offsets and is tabulated in the resource tables of the TRS. The TRS may be viewed on the Company’s website at: https://www.contangoore.com/investors/overview
ABOUT CORE
Contango is a New York Stock Exchange-American (NYSE – A) company that engages in exploration for gold and associated minerals in Alaska. Contango has a lease on the Lucky Shot Project from the underlying owner, Alaska Hardrock Inc. and through its subsidiary Contango Mineral Alaska, LLC, has 100% ownership of approximately 8,000 acres of peripheral State mining claims. The Company also holds a 30% interest in Peak Gold, LLC (the “Peak Gold JV”), which leases approximately 675,000 acres of exploration and development, with the remaining 70% owned by a subsidiary of Kinross Gold Corporation (“Kinross”), operator of the Peak Gold JV. Contango also owns a 100% interest in an additional approximately 137,280 acres of State of Alaska mining claims through Contango Mineral Alaska, LLC, its wholly owned subsidiary, which gives Contango the exclusive right to explore and develop minerals on these lands. Additional information can be found on our web page at www.contangoore.com.
Tables 1 to 3 show the classified mineral resource estimate as of May 26, 2023 for the Coleman and Lucky Shot Segments of the Lucky Shot Vein on Contango’s 100% owned Lucky Shot Project.
Table 1 COLEMAN SEGMENT Mineral Resource Estimate |
|||
Classification |
Tonnes |
Au Grade |
Au Ounces |
(g/t) |
|||
Measured |
- |
- |
- |
Indicated |
190,092 |
15.6 |
95,036 |
TOTAL |
190,092 |
15.6 |
95,036 |
Inferred |
74,265 |
9.9 |
23,642 |
Table 2 LUCKY SHOT SEGMENT MINERAL Resource Estimate |
|||
Classification |
Tonnes |
Au Grade |
Au Ounces |
(g/t) |
|||
Measured |
- |
- |
- |
Indicated |
36,871 |
8.9 |
10,584 |
TOTAL |
36,871 |
8.9 |
10,584 |
Inferred |
7,793 |
5.9 |
1,468 |
Table 3 COMBINED COLEMAN & LUCKY SHOT MINERAL Resource Estimate |
|||
Classification |
Tonnes |
Au Grade |
Au Ounces |
(g/t) |
|||
Measured |
- |
- |
- |
Indicated |
226,963 |
14.5 |
105,620 |
TOTAL |
226,963 |
14.5 |
105,620 |
Inferred |
82,058 |
9.5 |
25,110 |
Notes for Tables 1, 2 and 3: |
1. The mineral resources were estimated as of May 26, 2023 by SR, a third-party QP, under the definitions for mineral resources in S-K 1300. |
2. Mineral resources are estimated using long term prices of US$1,600/oz Au price. |
3. Mineral resources are reported using un-diluted Au grades. |
4. Mineral resources are reported as contained within 3.0 g/t Au underground shapes applying a 3.0m min. width at a 4.3 g/t COG. |
5. Mineral resources that are not mineral reserves do not have demonstrated economic viability. There are no mineral reserves for the Lucky Shot Project. |
6. Mineral resources are reported in dry metric tonnes. |
7. Numbers may not add due to rounding. |
8. Mineral resources are reported on a 100% ownership basis. |
TABLE 5 SIGNIFICANT DRILL INTERCEPTS FOR LSU22001-LSU22029 |
||||
Drillhole Name |
From (m) |
To (m) |
Interval (m) |
Gold (g/t) |
LSU22001 |
192.63 |
197.97 |
5.34 |
2.49 |
LSU22001 |
243.26 |
246.86 |
3.6 |
1.18 |
LSU22002 |
164.82 |
177.93 |
13.11 |
1.64 |
LSU22002 |
221.67 |
222.86 |
1.19 |
5.44 |
LSU22002 |
236.22 |
237.44 |
1.22 |
11.35 |
LSU22003 |
163.98 |
166.76 |
2.78 |
1.02 |
LSU22003 |
169.75 |
170.29 |
0.54 |
1.02 |
LSU22004 |
172.06 |
174.65 |
2.59 |
1.07 |
LSU22004 |
214.09 |
215.35 |
1.26 |
2.42 |
LSU22004 |
216.68 |
218.41 |
1.73 |
2.63 |
LSU22005 |
131.34 |
131.52 |
0.18 |
2.34 |
LSU22005 |
179.41 |
180.96 |
1.55 |
5.78 |
LSU22005 |
190.42 |
192.46 |
2.04 |
23.00 |
LSU22006 |
60.35 |
61.36 |
1.01 |
7.94 |
LSU22006 |
185 |
193.28 |
8.28 |
2.42 |
Incl. |
190.37 |
191.11 |
0.74 |
6.06 |
LSU22007 |
59.13 |
61.16 |
2.03 |
1.39 |
LSU22007 |
167.93 |
168.49 |
0.56 |
11.95 |
LSU22007 |
171.6 |
175.19 |
3.59 |
3.74 |
Incl. |
174.65 |
175.19 |
0.54 |
11.90 |
LSU22008 |
24.45 |
25.03 |
0.58 |
2.74 |
LSU22008 |
150.14 |
150.59 |
0.45 |
1.30 |
LSU22009 |
200.72 |
203.61 |
2.89 |
1.05 |
LSU22009 |
229.51 |
231.04 |
1.53 |
2.66 |
LSU22010 |
No Significant Intercepts |
|||
LSU22011 |
8.8 |
10.51 |
1.71 |
1.15 |
LSU22011 |
41.82 |
42.49 |
0.67 |
2.80 |
LSU22012 |
5.18 |
6.1 |
0.92 |
1.22 |
LSU22013 |
24.35 |
25.08 |
0.73 |
42.00 |
LSU22014 |
No Significant Intercepts |
|||
LSU22015 |
20.34 |
22.25 |
1.91 |
5.83 |
Incl. |
20.34 |
20.87 |
0.53 |
19.40 |
LSU22016 |
4.65 |
6.6 |
1.95 |
1.31 |
LSU22016 |
21.1 |
21.65 |
0.55 |
26.30 |
LSU22017 |
7.88 |
8.53 |
0.65 |
1.31 |
LSU22018 |
58.35 |
58.93 |
0.58 |
7.70 |
LSU22019 |
21.1 |
21.95 |
0.85 |
1.08 |
LSU22019 |
60.75 |
61.28 |
0.53 |
26.30 |
LSU22019 |
63.24 |
64.39 |
1.15 |
1.75 |
LSU22020 |
33.31 |
34.44 |
1.13 |
1.89 |
LSU22020 |
69.19 |
70.71 |
1.52 |
1.59 |
LSU22021 |
48.16 |
50.15 |
1.99 |
9.53 |
Incl. |
49.44 |
50.15 |
0.71 |
21.50 |
LSU22021 |
78.64 |
81.95 |
3.31 |
3.92 |
Incl. |
79.78 |
80.32 |
0.54 |
9.99 |
LSU22022 |
0 |
0.6 |
0.6 |
4.86 |
LSU22022 |
67.97 |
72.54 |
4.57 |
1.82 |
LSU22022 |
75.59 |
78.64 |
3.05 |
1.77 |
LSU22022 |
91.43 |
92.43 |
1 |
6.80 |
Incl. |
91.93 |
92.43 |
0.5 |
12.00 |
LSU22023 |
2.44 |
3.46 |
1.02 |
1.22 |
LSU22023 |
8.03 |
9.65 |
1.62 |
7.64 |
Incl. |
8.53 |
9.09 |
0.56 |
15.30 |
LSU22023 |
106.99 |
109.67 |
2.68 |
1.43 |
LSU22024 |
49.4 |
50.54 |
1.14 |
27.72 |
Incl. |
49.4 |
49.99 |
0.59 |
51.30 |
LSU22024 |
53.78 |
54.56 |
0.78 |
1.17 |
LSU22024 |
56.08 |
56.67 |
0.59 |
1.43 |
LSU22025 |
19.92 |
20.48 |
0.56 |
3.43 |
LSU22025 |
50.19 |
50.95 |
0.76 |
27.20 |
LSU22025 |
54.16 |
55.78 |
1.62 |
4.26 |
LSU22026 |
24.5 |
25.02 |
0.52 |
2.22 |
LSU22026 |
31.3 |
31.92 |
0.62 |
1.31 |
LSU22026 |
57.38 |
57.99 |
0.61 |
4.23 |
LSU22027 |
55.6 |
56.35 |
0.75 |
1.72 |
LSU22027 |
74.95 |
76.5 |
1.55 |
1.15 |
LSU22028 |
104.85 |
105.41 |
0.56 |
1.57 |
LSU22029 |
45.82 |
48.25 |
2.43 |
2.19 |
FORWARD-LOOKING STATEMENTS
This press release contains forward-looking statements regarding CORE that are intended to be covered by the safe harbor for “forward-looking statements” provided by the Private Securities Litigation Reform Act of 1995, based on CORE’s current expectations and includes statements regarding future results of operations, quality and nature of the asset base, the assumptions upon which estimates are based and other expectations, beliefs, plans, objectives, assumptions, strategies or statements about future events or performance (often, but not always, using words such as “expects”, “projects”, “anticipates”, “plans”, “estimates”, “potential”, “possible”, “probable”, or “intends”, or stating that certain actions, events or results “may”, “will”, “should”, or “could” be taken, occur or be achieved). Forward-looking statements are based on current expectations, estimates and projections that involve a number of risks and uncertainties, which could cause actual results to differ materially from those, reflected in the statements. These risks include, but are not limited to: the risks of the exploration and the mining industry (for example, operational risks in exploring for, developing mineral reserves; risks and uncertainties involving geology; the speculative nature of the mining industry; the uncertainty of estimates and projections relating to future production, costs and expenses; the volatility of natural resources prices, including prices of gold and associated minerals; the existence and extent of commercially exploitable minerals in properties acquired by CORE or the Peak Gold JV; ability to realize the anticipated benefits of the Peak Gold JV; potential delays or changes in plans with respect to exploration or development projects or capital expenditures; the interpretation of exploration results and the estimation of mineral resources; the loss of key employees or consultants; health, safety and environmental risks and risks related to weather and other natural disasters); uncertainties as to the availability and cost of financing; CORE’s inability to retain or maintain its relative ownership interest in the Peak Gold JV; inability to realize expected value from acquisitions; inability of our management team to execute its plans to meet its goals; the extent of disruptions caused by an outbreak of disease, such as the COVID-19 pandemic; and the possibility that government policies may change, political developments may occur or governmental approvals may be delayed or withheld, including as a result of presidential and congressional elections in the U.S. or the inability to obtain mining permits. Additional information on these and other factors which could affect CORE’s exploration program or financial results are included in CORE’s other reports on file with the U.S. Securities and Exchange Commission. Investors are cautioned that any forward-looking statements are not guarantees of future performance and actual results or developments may differ materially from the projections in the forward-looking statements. Forward-looking statements are based on the estimates and opinions of management at the time the statements are made. CORE does not assume any obligation to update forward-looking statements should circumstances or management’s estimates or opinions change.
View source version on businesswire.com: https://www.businesswire.com/news/home/20230611291179/en/
Contacts
Contango ORE, Inc.
Rick Van Nieuwenhuyse
(713) 877-1311
www.contangoore.com


