 Fintech personal finance company Sofi Technologies (NASDAQ: SOFI) stock has fallen (-65%) for the year. The Company has continued to grow retail accounts pushing towards diversifying its services beyond lending services. It has built an eco-system of complementary financial products and services that benefit from the network effect driving cross-buying from its customers. The financial services segment is the future growth driver, while lending makes up for the bulk of revenues and profits. The Company may be showing losses, but that’s mostly due to building out its financial products as it continues to evolve into a complete one-stop shop for digital financial services. It serves the ideal generational group of college students that may use the platform initially for student loans and continue to use more of the services throughout their careers after college and into retirement. These fintech services include banking, loans, cash management, and investment services including IPOs, SPACs, stock, and cryptocurrencies trading. The familiarity and trust of the brand are very important, which is why they have named SoFi Stadium in Inglewood, CA. home of the Los Angeles Chargers and Los Angeles Rams.
Generational Customers
While banks tend to market for generational customers, SoFi’s main business of lending naturally caters to college students. The Company is building out its eco-system gathering generational customers at the beginning of their financial lives with the goal of cross-selling its products throughout their life span. The strategy is working as the Company continues to show double digit growth in all areas. The student loans literally lock in a student customers for the duration of the student loan and can cross-sell more services in the meantime. These are ‘warm leads’ as its customer base continues to grow with more brand recognition. SoFi competes with individual competitors that offer competing financial products and services like Robinhood (NASDAQ: HOOD) for stock trading, Charles Schwab (NYSE: SCHW) for retail investors, Coinbase Global (NASDAQ: COIN) for crypto trading, Bank of America (NYSE: BAC) for banking and mortgage services, Ally Financial (NYSE: ALLY), Upstart Holdings (NASDAQ: UPST), and Lending Club (NYSE: LC) for loans.
Double-Digit Growth Metrics
The Company reported adjusted earnings-per-share (EPS) loss of (-$0.09) missing consensus analyst estimates for a loss of (-$0.07) by (-$0.02). Total revenues rose 51.3% YoY to $419.26 million versus $391.78 million consensus analyst estimates. GAAP net revenues grew 56% to a record $424 million. Adjusted EBITDA rose 332% YoY to $44 million. Sofi added 424,00 new members for a total of $4.4 million, up 61% YoY. New product adds were up 69% at 635,000 to nearly 7.2 million. SoFi makes money on net interest income on deposits and from holding loans. Total deposits grew 86% to $5 billion and 85% of SoFi Money deposits came from direct deposit members. The Company operates three segments, lending, financial services, and technology. Lending consist of student, personal and home loans and saw 24% YoY growth to $301.7 million net revenues driven by record demand for personal loans originations of over $2.8 billion. Financial Services saw 83% growth to 5.9 million products and 288% net revenue growth to $49 million. This consisted of SoFi Money growth of 79%, SoFi Investor growth of 68%, and SoFi Relay growth of 113%. Technology Platform enabled accounts rose 40% YoY to 124.3 million generating a 69% YoY top line of $84.8 million.
Raised Top Line Guidance
The Company raised adjusted revenue guidance for fiscal full-year 2022 to $1.517 billion to $1.522 billion, versus $1.50 billion consensus analyst estimates. SoFi CEO Anthony Noto commented, “As a result of this growth in high-quality deposits, we have benefited from a lower cost of funding for our loans. Our deposit funding also increases our flexibility to capture additional net interest margin (NIM) and optimize returns, a critical advantage in light of notable macro uncertainty. In its second full quarter of operations, SoFi Bank, N.A. generated approximately $29 million of positive GAAP net income at an 11% margin.”
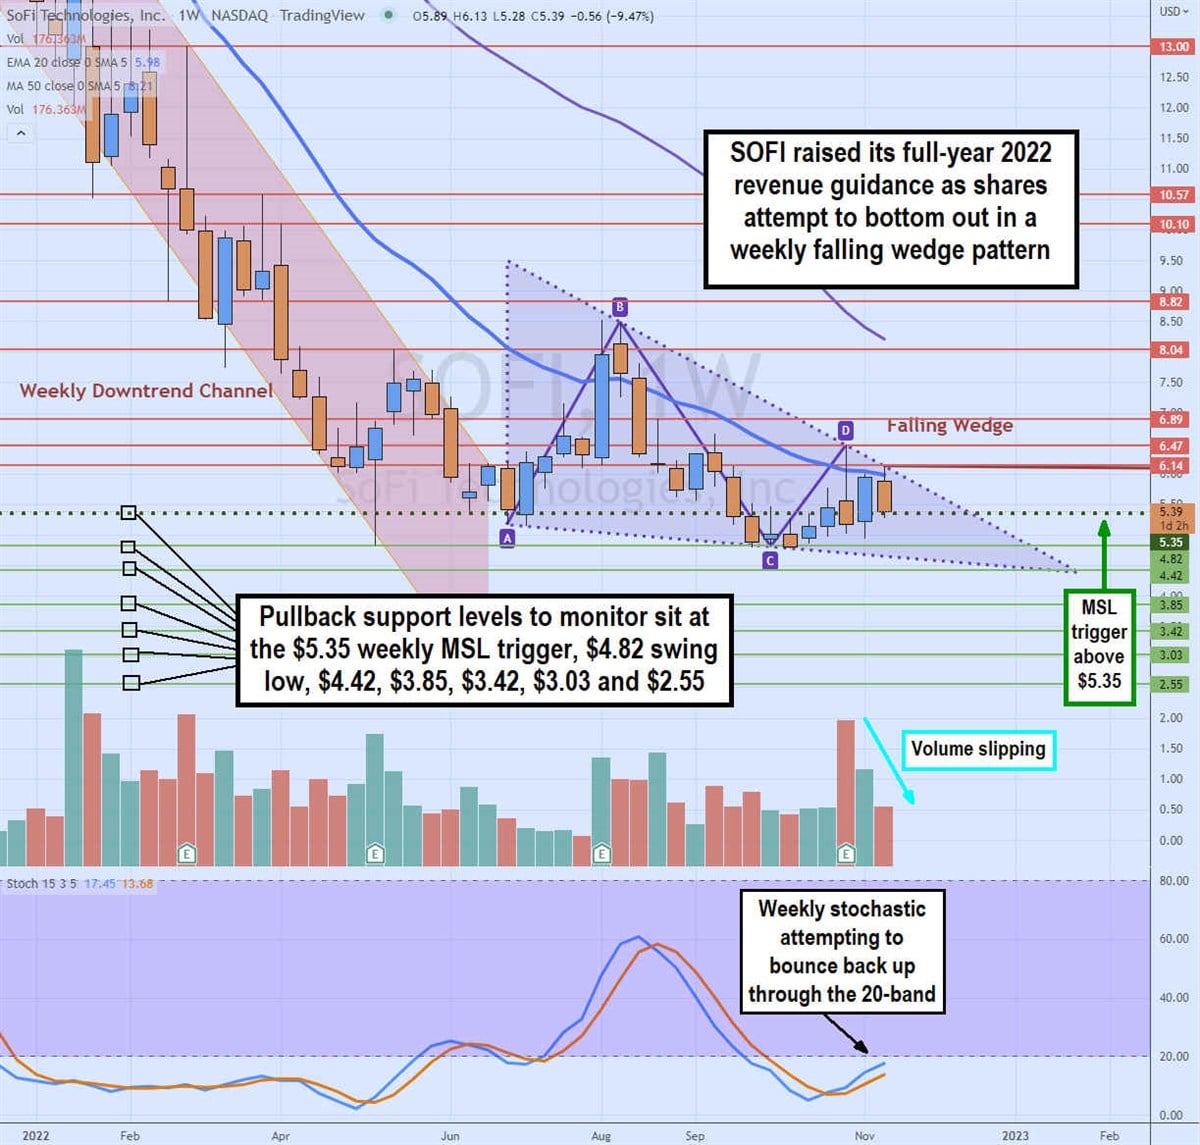
Here’s What the Charts Say
The weekly candlestick chart for SOFI illustrates the falling downtrend price channel that spawned upon the weekly 5-period exponential moving average (EMA) crossing down through the 50-period MA in November 2021. This breakdown occurred on the $18 break and continued to sell-off until it staged a rally from June 2022 to August 2022 reaching a high of $8.52 (B) before falling back down to a new swing low at $4.82 (C). From here, it bounced again to peak at $6.47 (D) for a retracement that is attempting to hold above the weekly market structure low (MSL) trigger at $5.35. This weekly falling wedge pattern has a potential breakout if buyers are drive it through the $6.14 resistance on volume and maintain the level as support on pullbacks. The weekly stochastic has crossed up again looking to attempt a bounce through the 20-band. The weekly 20-period EMA resistance sits at $5.98 and 50-period falling resistance sits at $8.21. Upside target is the distance between point A and B ($3.32) added to the breakout level at $6.14 for a potential move to $9.79 (AB+D). If shares collapse through the lower trend line, then pullback support levels to watch sit at the $4.42, $3.85, $3.42, and $2.35 price levels.


