
Trucking company PACCAR (NASDAQ: PCAR) fell short of the market’s revenue expectations in Q3 CY2025, with sales falling 25.9% year on year to $6.11 billion. Its GAAP profit of $1.12 per share was 2.6% below analysts’ consensus estimates.
Is now the time to buy PACCAR? Find out by accessing our full research report, it’s free for active Edge members.
PACCAR (PCAR) Q3 CY2025 Highlights:
- Revenue: $6.11 billion vs analyst estimates of $6.62 billion (25.9% year-on-year decline, 7.7% miss)
- EPS (GAAP): $1.12 vs analyst expectations of $1.15 (2.6% miss)
- Operating Margin: 10.2%, down from 12.3% in the same quarter last year
- Free Cash Flow Margin: 22.3%, up from 13.3% in the same quarter last year
- Market Capitalization: $51.19 billion
BELLEVUE, Wash.--(BUSINESS WIRE)--“PACCAR achieved good revenues and net income in the second quarter of 2025,” said Preston Feight, chief executive officer.
Company Overview
Founded more than a century ago, PACCAR (NASDAQ: PCAR) designs and manufactures commercial trucks of various weights and sizes for the commercial trucking industry.
Revenue Growth
A company’s long-term sales performance is one signal of its overall quality. Even a bad business can shine for one or two quarters, but a top-tier one grows for years. Luckily, PACCAR’s sales grew at a decent 8.5% compounded annual growth rate over the last five years. Its growth was slightly above the average industrials company and shows its offerings resonate with customers.
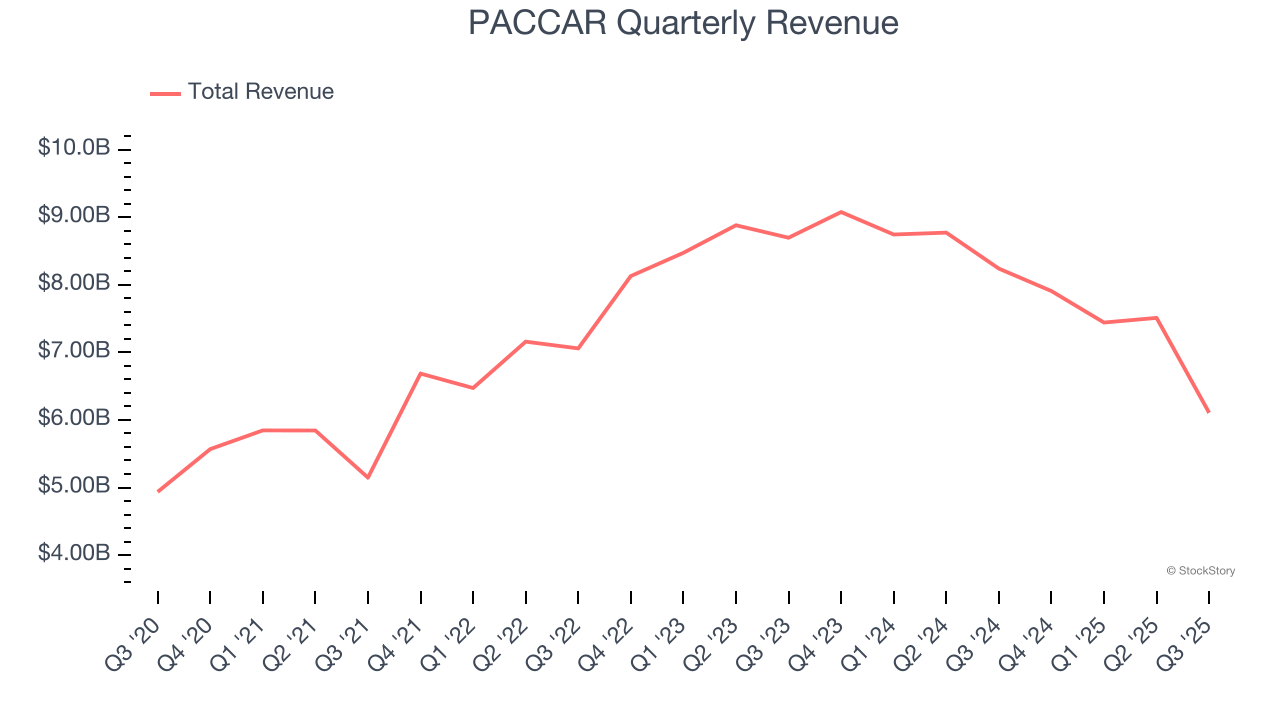
We at StockStory place the most emphasis on long-term growth, but within industrials, a half-decade historical view may miss cycles, industry trends, or a company capitalizing on catalysts such as a new contract win or a successful product line. PACCAR’s recent performance marks a sharp pivot from its five-year trend as its revenue has shown annualized declines of 7.9% over the last two years. PACCAR isn’t alone in its struggles as the Heavy Transportation Equipment industry experienced a cyclical downturn, with many similar businesses observing lower sales at this time. 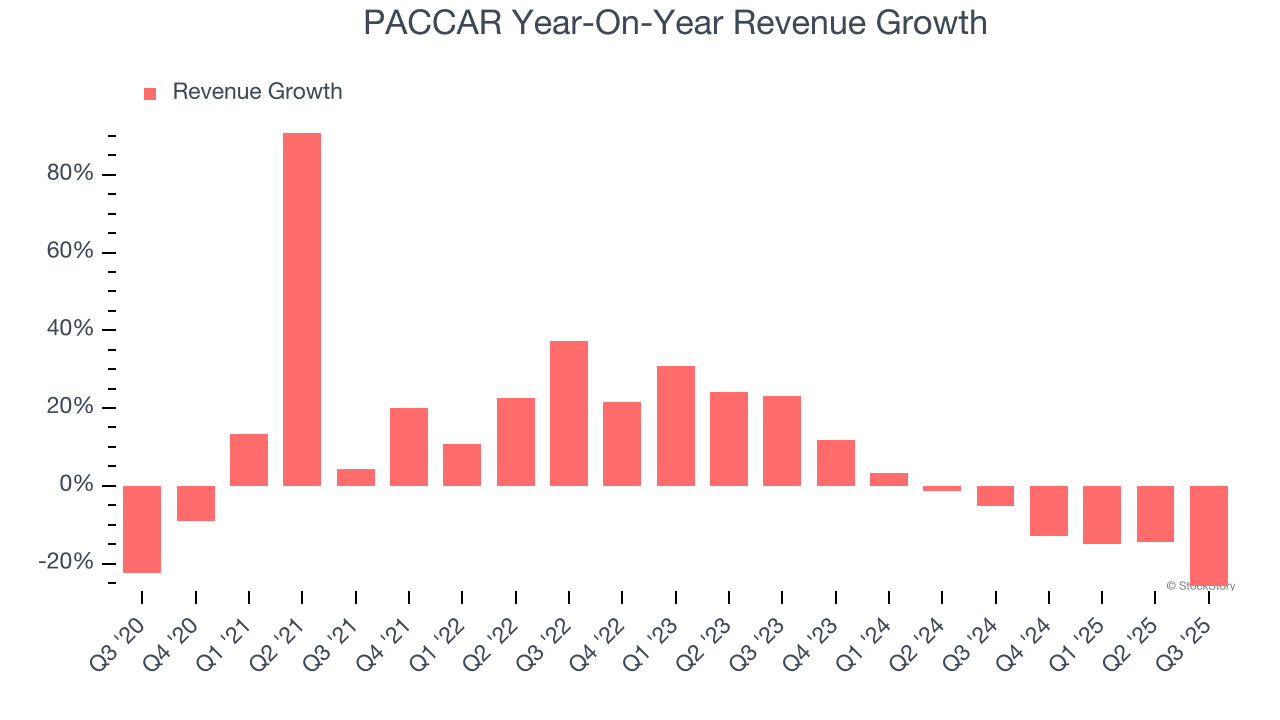
This quarter, PACCAR missed Wall Street’s estimates and reported a rather uninspiring 25.9% year-on-year revenue decline, generating $6.11 billion of revenue.
Looking ahead, sell-side analysts expect revenue to remain flat over the next 12 months. While this projection suggests its newer products and services will catalyze better top-line performance, it is still below average for the sector.
Today’s young investors won’t have read the timeless lessons in Gorilla Game: Picking Winners In High Technology because it was written more than 20 years ago when Microsoft and Apple were first establishing their supremacy. But if we apply the same principles, then enterprise software stocks leveraging their own generative AI capabilities may well be the Gorillas of the future. So, in that spirit, we are excited to present our Special Free Report on a profitable, fast-growing enterprise software stock that is already riding the automation wave and looking to catch the generative AI next.
Operating Margin
PACCAR has managed its cost base well over the last five years. It demonstrated solid profitability for an industrials business, producing an average operating margin of 11.8%. This result was particularly impressive because of its low gross margin, which is mostly a factor of what it sells and takes huge shifts to move meaningfully. Companies have more control over their operating margins, and it’s a show of well-managed operations if they’re high when gross margins are low.
Analyzing the trend in its profitability, PACCAR’s operating margin rose by 2.2 percentage points over the last five years, as its sales growth gave it operating leverage.
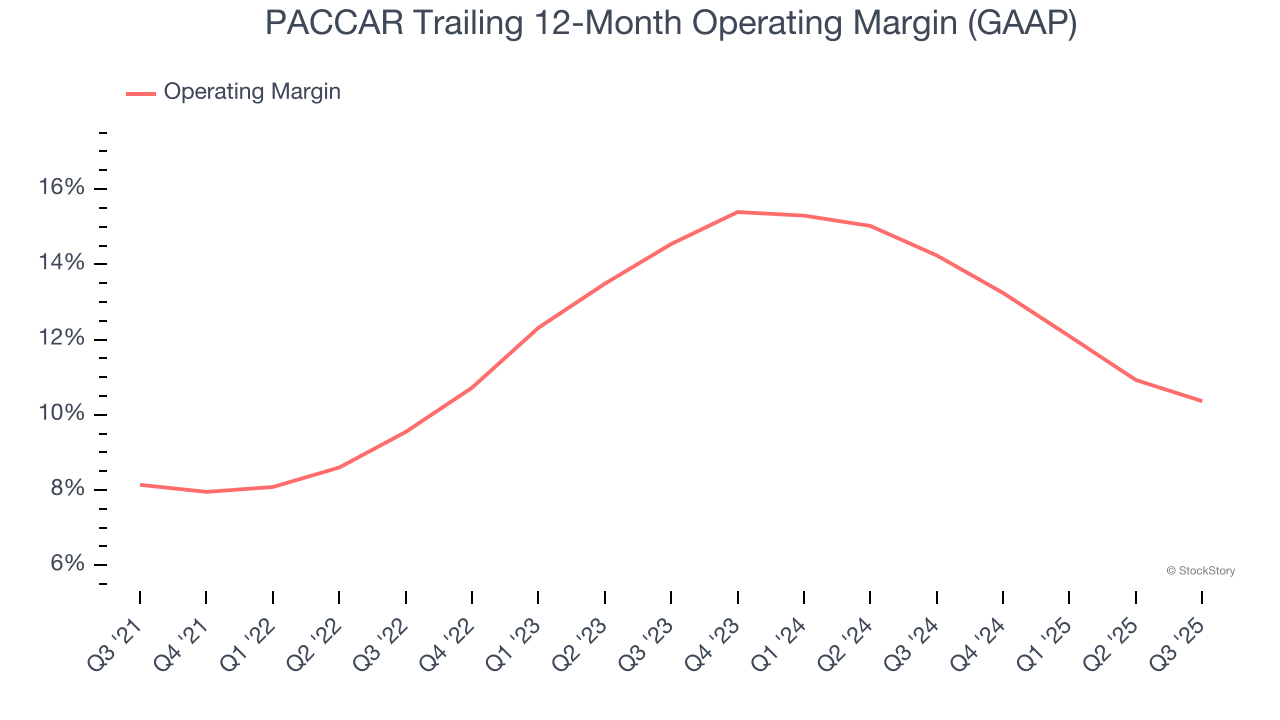
In Q3, PACCAR generated an operating margin profit margin of 10.2%, down 2.2 percentage points year on year. Since PACCAR’s gross margin decreased more than its operating margin, we can assume its recent inefficiencies were driven more by weaker leverage on its cost of sales rather than increased marketing, R&D, and administrative overhead expenses.
Earnings Per Share
Revenue trends explain a company’s historical growth, but the long-term change in earnings per share (EPS) points to the profitability of that growth – for example, a company could inflate its sales through excessive spending on advertising and promotions.
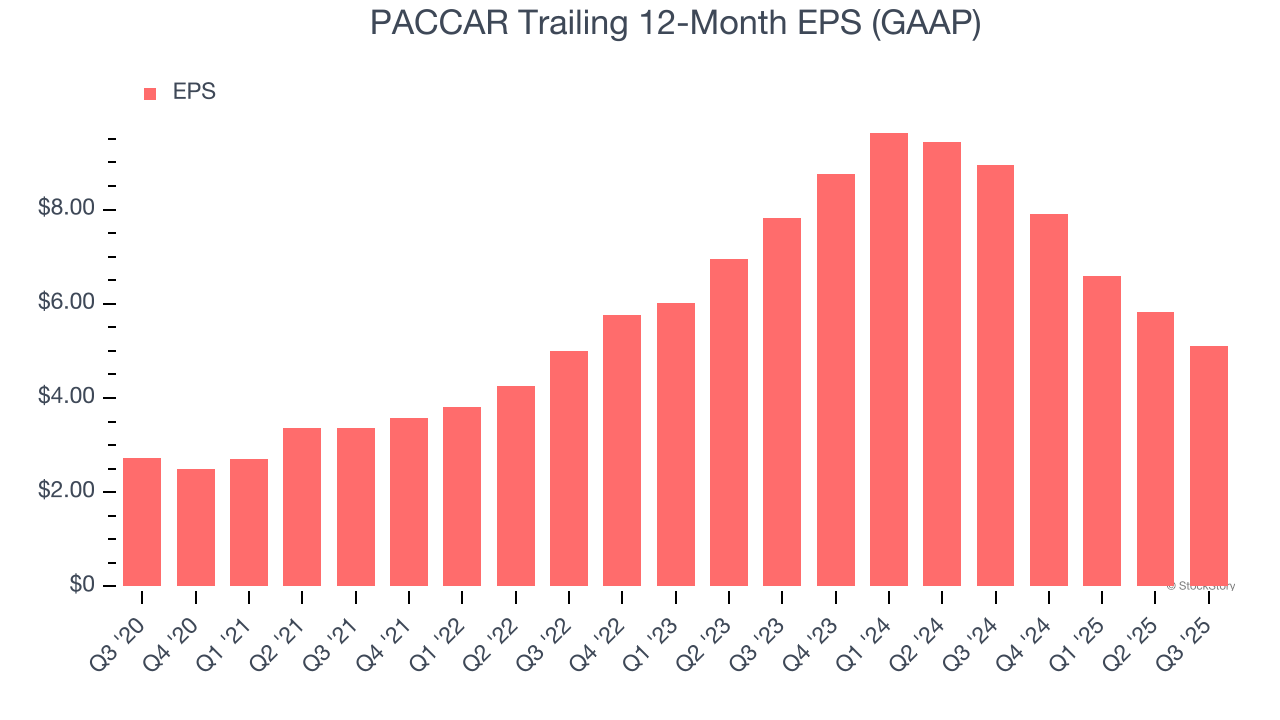
PACCAR’s EPS grew at a remarkable 13.4% compounded annual growth rate over the last five years, higher than its 8.5% annualized revenue growth. This tells us the company became more profitable on a per-share basis as it expanded.
Diving into PACCAR’s quality of earnings can give us a better understanding of its performance. As we mentioned earlier, PACCAR’s operating margin declined this quarter but expanded by 2.2 percentage points over the last five years. This was the most relevant factor (aside from the revenue impact) behind its higher earnings; interest expenses and taxes can also affect EPS but don’t tell us as much about a company’s fundamentals.
Like with revenue, we analyze EPS over a shorter period to see if we are missing a change in the business.
For PACCAR, its two-year annual EPS declines of 19.2% mark a reversal from its (seemingly) healthy five-year trend. We hope PACCAR can return to earnings growth in the future.
In Q3, PACCAR reported EPS of $1.12, down from $1.85 in the same quarter last year. This print missed analysts’ estimates, but we care more about long-term EPS growth than short-term movements. Over the next 12 months, Wall Street expects PACCAR’s full-year EPS of $5.11 to grow 9%.
Key Takeaways from PACCAR’s Q3 Results
Revenue and EPS both missed in the quarter. Overall, this was a weaker quarter. The stock traded down 4% to $93.58 immediately following the results.
The latest quarter from PACCAR’s wasn’t that good. One earnings report doesn’t define a company’s quality, though, so let’s explore whether the stock is a buy at the current price. We think that the latest quarter is only one piece of the longer-term business quality puzzle. Quality, when combined with valuation, can help determine if the stock is a buy. We cover that in our actionable full research report which you can read here, it’s free for active Edge members.


