
Railcar products and services provider Trinity (NYSE: TRN) fell short of the market’s revenue expectations in Q4 CY2024, with sales falling 21.1% year on year to $629.4 million. Its GAAP profit of $0.34 per share was 3% above analysts’ consensus estimates.
Is now the time to buy Trinity? Find out by accessing our full research report, it’s free.
Trinity (TRN) Q4 CY2024 Highlights:
- Revenue: $629.4 million vs analyst estimates of $726.6 million (21.1% year-on-year decline, 13.4% miss)
- EPS (GAAP): $0.34 vs analyst estimates of $0.33 (3% beat)
- Adjusted EBITDA: $192.7 million vs analyst estimates of $186 million (30.6% margin, 3.6% beat)
- EPS (GAAP) guidance for the upcoming financial year 2025 is $1.65 at the midpoint, beating analyst estimates by 3.1%
- Operating Margin: 17.8%, in line with the same quarter last year
- Free Cash Flow was -$21.6 million, down from $33.4 million in the same quarter last year
- Market Capitalization: $2.81 billion
“Trinity Industries’ 2024 full year adjusted EPS of $1.82 represents a 32% increase over 2023, driven by higher lease rates, significantly improved margin performance, and a higher volume of external repairs. I extend my gratitude to the Trinity team for their outstanding efforts this year,” stated Trinity’s Chief Executive Officer and President Jean Savage.
Company Overview
Operating under the trade name TrinityRail, Trinity (NYSE: TRN) is a provider of railcar products and services in North America.
Heavy Transportation Equipment
Heavy transportation equipment companies are investing in automated vehicles that increase efficiencies and connected machinery that collects actionable data. Some are also developing electric vehicles and mobility solutions to address customers’ concerns about carbon emissions, creating new sales opportunities. Additionally, they are increasingly offering automated equipment that increases efficiencies and connected machinery that collects actionable data. On the other hand, heavy transportation equipment companies are at the whim of economic cycles. Interest rates, for example, can greatly impact the construction and transport volumes that drive demand for these companies’ offerings.
Sales Growth
A company’s long-term performance is an indicator of its overall quality. While any business can experience short-term success, top-performing ones enjoy sustained growth for years. Unfortunately, Trinity struggled to consistently increase demand as its $3.08 billion of sales for the trailing 12 months was close to its revenue five years ago. This was below our standards and is a rough starting point for our analysis.
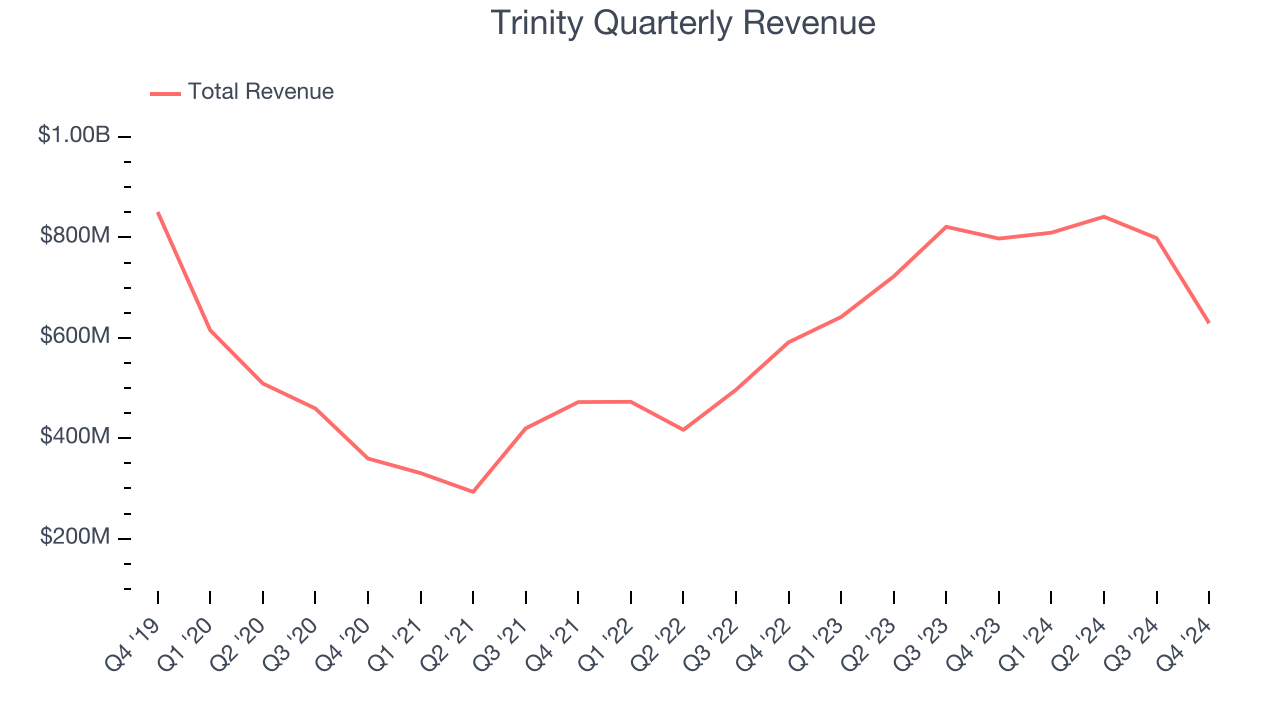
We at StockStory place the most emphasis on long-term growth, but within industrials, a half-decade historical view may miss cycles, industry trends, or a company capitalizing on catalysts such as a new contract win or a successful product line. Trinity’s annualized revenue growth of 24.8% over the last two years is above its five-year trend, suggesting its demand recently accelerated. 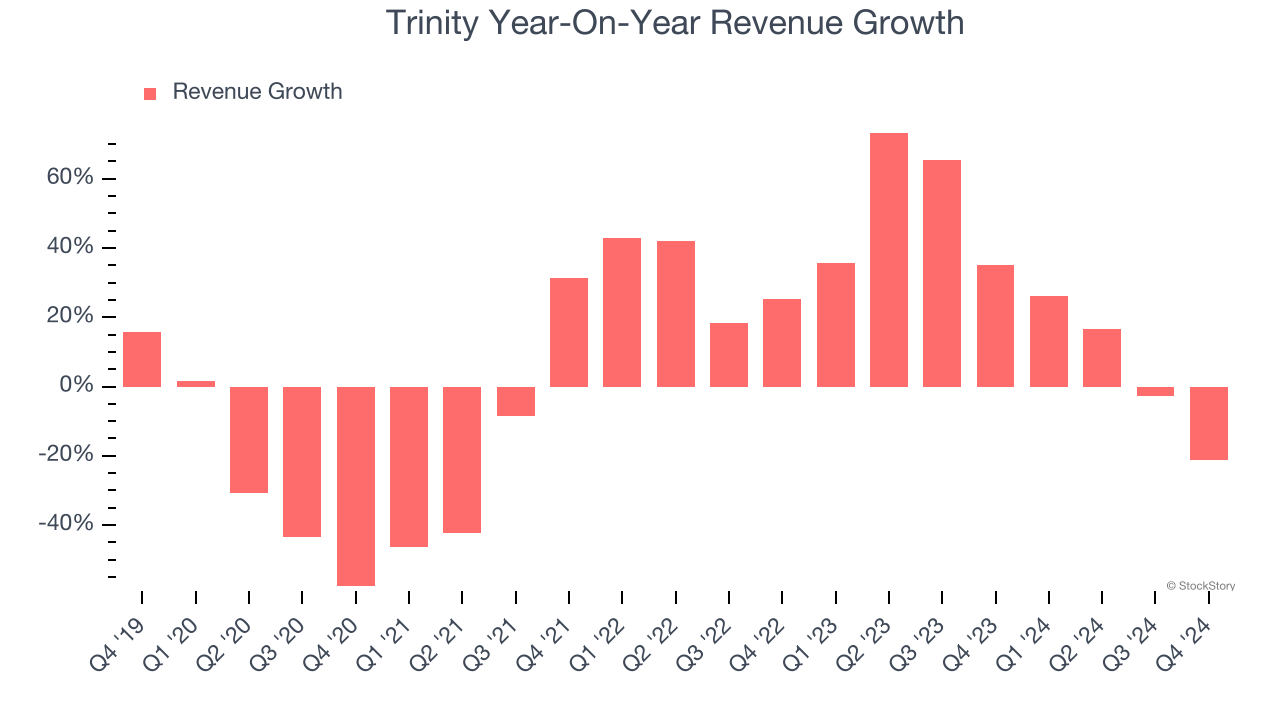
This quarter, Trinity missed Wall Street’s estimates and reported a rather uninspiring 21.1% year-on-year revenue decline, generating $629.4 million of revenue.
Looking ahead, sell-side analysts expect revenue to grow 2.1% over the next 12 months, a deceleration versus the last two years. This projection doesn't excite us and implies its products and services will face some demand challenges.
Today’s young investors won’t have read the timeless lessons in Gorilla Game: Picking Winners In High Technology because it was written more than 20 years ago when Microsoft and Apple were first establishing their supremacy. But if we apply the same principles, then enterprise software stocks leveraging their own generative AI capabilities may well be the Gorillas of the future. So, in that spirit, we are excited to present our Special Free Report on a profitable, fast-growing enterprise software stock that is already riding the automation wave and looking to catch the generative AI next.
Operating Margin
Operating margin is an important measure of profitability as it shows the portion of revenue left after accounting for all core expenses – everything from the cost of goods sold to advertising and wages. It’s also useful for comparing profitability across companies with different levels of debt and tax rates because it excludes interest and taxes.
Trinity has managed its cost base well over the last five years. It demonstrated solid profitability for an industrials business, producing an average operating margin of 11.8%. This result was particularly impressive because of its low gross margin, which is mostly a factor of what it sells and takes huge shifts to move meaningfully. Companies have more control over their operating margins, and it’s a show of well-managed operations if they’re high when gross margins are low.
Analyzing the trend in its profitability, Trinity’s operating margin rose by 22.3 percentage points over the last five years, showing its efficiency has meaningfully improved.
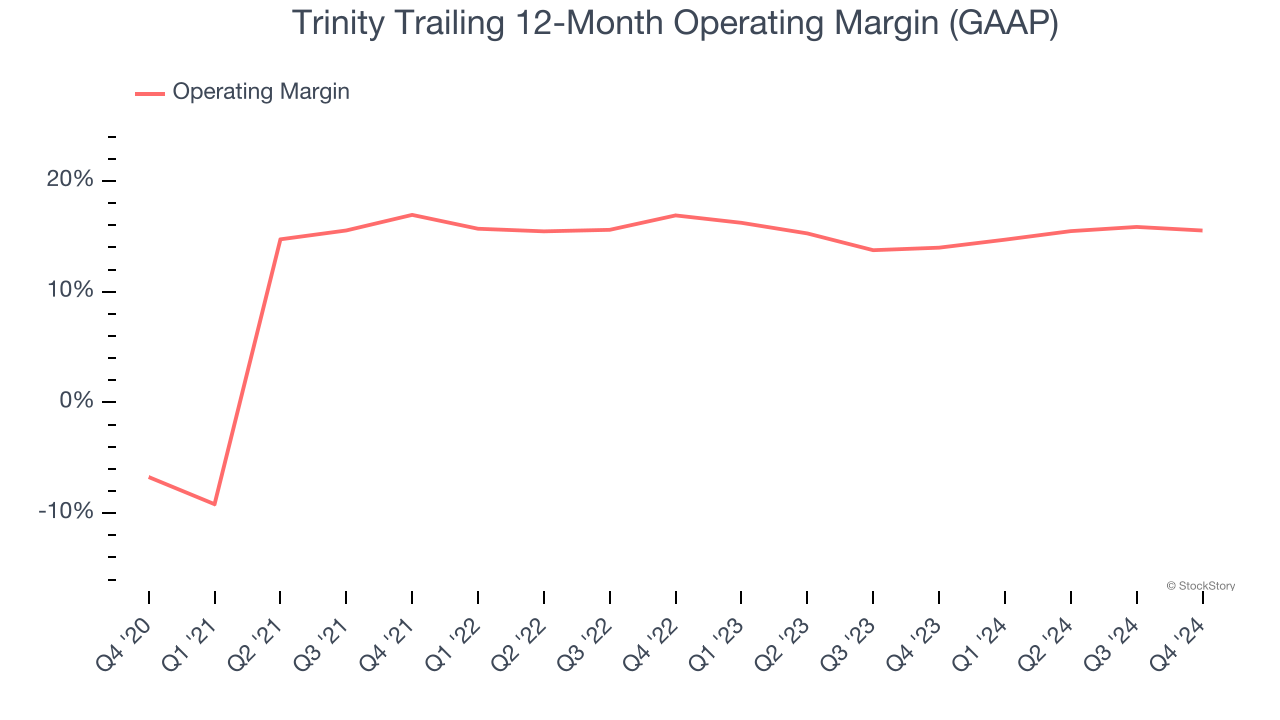
In Q4, Trinity generated an operating profit margin of 17.8%, in line with the same quarter last year. This indicates the company’s cost structure has recently been stable.
Earnings Per Share
Revenue trends explain a company’s historical growth, but the long-term change in earnings per share (EPS) points to the profitability of that growth – for example, a company could inflate its sales through excessive spending on advertising and promotions.
Trinity’s EPS grew at a decent 8.7% compounded annual growth rate over the last five years, higher than its flat revenue. This tells us management responded to softer demand by adapting its cost structure.
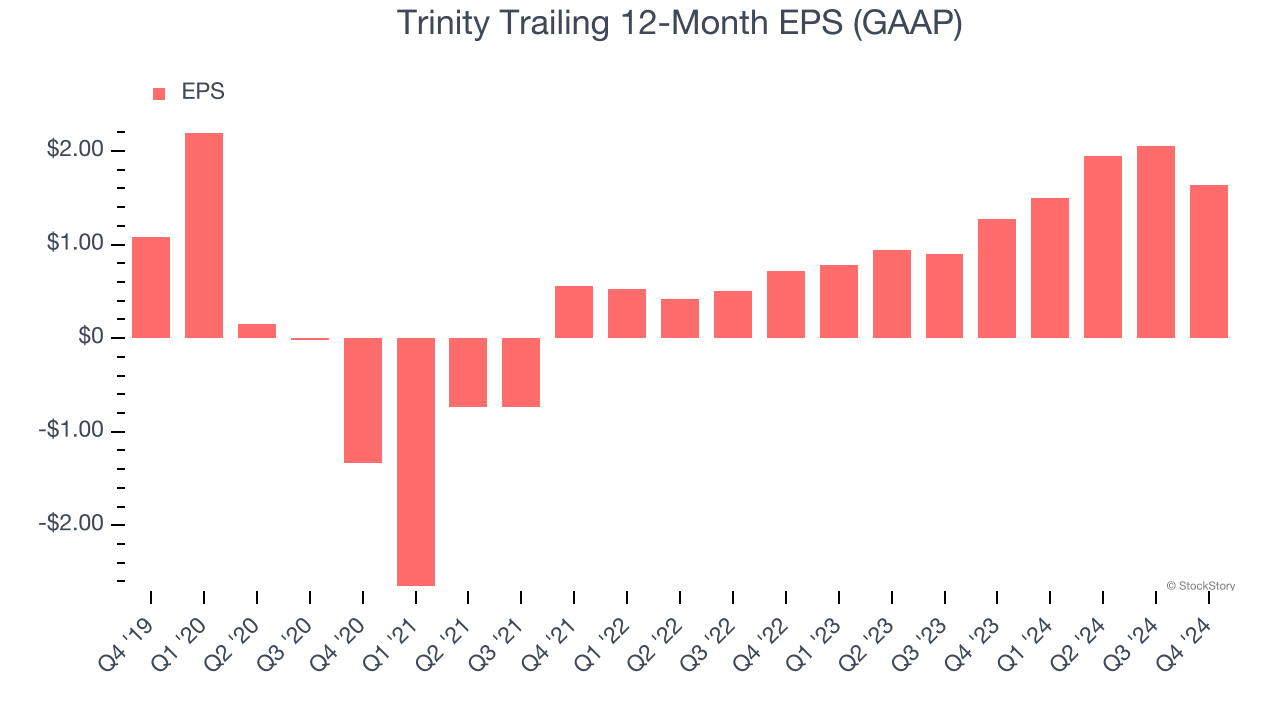
Diving into Trinity’s quality of earnings can give us a better understanding of its performance. As we mentioned earlier, Trinity’s operating margin was flat this quarter but expanded by 22.3 percentage points over the last five years. On top of that, its share count shrank by 30.5%. These are positive signs for shareholders because improving profitability and share buybacks turbocharge EPS growth relative to revenue growth. 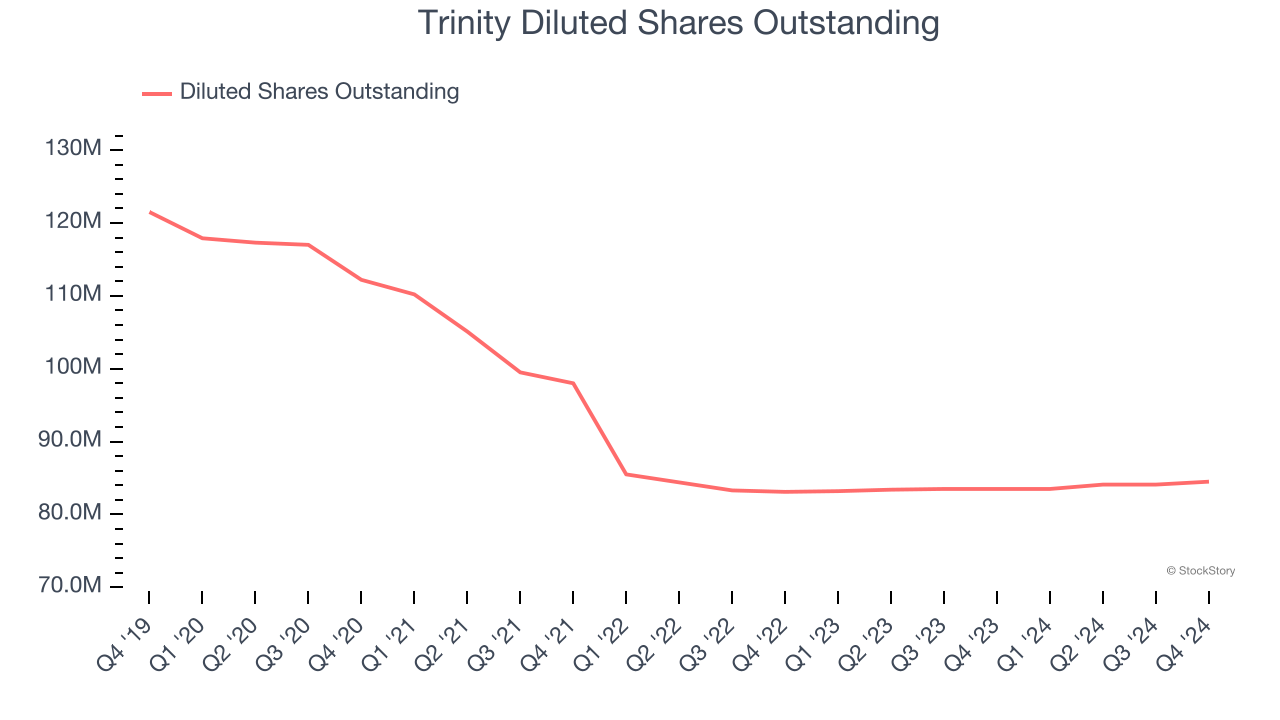
Like with revenue, we analyze EPS over a more recent period because it can provide insight into an emerging theme or development for the business.
For Trinity, its two-year annual EPS growth of 50.7% was higher than its five-year trend. This acceleration made it one of the faster-growing industrials companies in recent history.
In Q4, Trinity reported EPS at $0.34, down from $0.75 in the same quarter last year. Despite falling year on year, this print beat analysts’ estimates by 3%. Over the next 12 months, Wall Street expects Trinity’s full-year EPS of $1.64 to shrink by 1.9%.
Key Takeaways from Trinity’s Q4 Results
We were impressed by Trinity’s optimistic full-year EPS guidance, which blew past analysts’ expectations. We were also happy its EBITDA outperformed Wall Street’s estimates. On the other hand, its revenue missed. Overall, this quarter had some key positives. The stock traded up 2.3% to $35 immediately after reporting.
Is Trinity an attractive investment opportunity at the current price? We think that the latest quarter is only one piece of the longer-term business quality puzzle. Quality, when combined with valuation, can help determine if the stock is a buy. We cover that in our actionable full research report which you can read here, it’s free.


