
Medical device company DexCom (NASDAQ: DXCM) announced better-than-expected revenue in Q4 CY2025, with sales up 13.1% year on year to $1.26 billion. The company expects the full year’s revenue to be around $5.21 billion, close to analysts’ estimates. Its non-GAAP profit of $0.68 per share was 4.5% above analysts’ consensus estimates.
Is now the time to buy DexCom? Find out by accessing our full research report, it’s free.
DexCom (DXCM) Q4 CY2025 Highlights:
- Revenue: $1.26 billion vs analyst estimates of $1.25 billion (13.1% year-on-year growth, 0.8% beat)
- Adjusted EPS: $0.68 vs analyst estimates of $0.65 (4.5% beat)
- Adjusted EBITDA: $422.2 million vs analyst estimates of $425.5 million (33.5% margin, 0.8% miss)
- Operating Margin: 25.6%, up from 17% in the same quarter last year
- Organic Revenue rose 12% year on year (beat)
- Market Capitalization: $26.58 billion
Company Overview
Founded in 1999 and receiving its first FDA approval in 2006, DexCom (NASDAQ: DXCM) develops and sells continuous glucose monitoring systems that allow people with diabetes to track their blood sugar levels without repeated finger pricks.
Revenue Growth
A company’s long-term sales performance can indicate its overall quality. Any business can experience short-term success, but top-performing ones enjoy sustained growth for years. Over the last five years, DexCom grew its sales at an impressive 19.3% compounded annual growth rate. Its growth surpassed the average healthcare company and shows its offerings resonate with customers, a great starting point for our analysis.
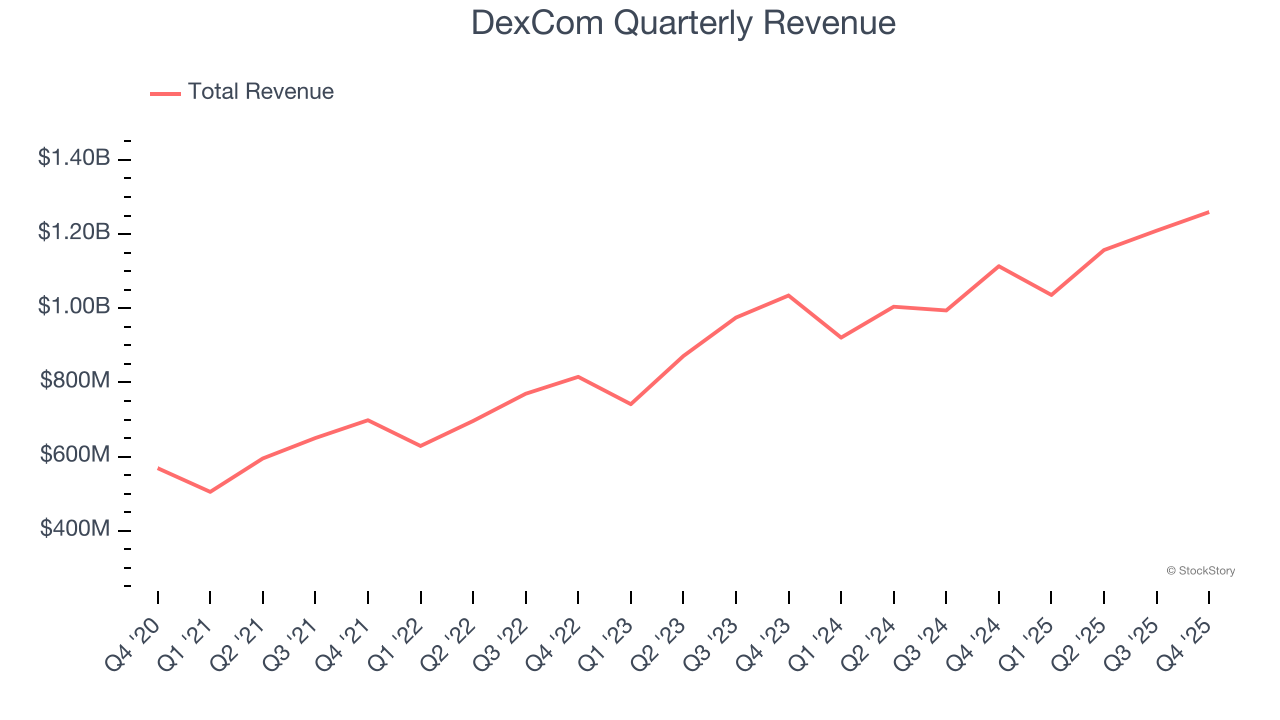
We at StockStory place the most emphasis on long-term growth, but within healthcare, a half-decade historical view may miss recent innovations or disruptive industry trends. DexCom’s annualized revenue growth of 13.4% over the last two years is below its five-year trend, but we still think the results suggest healthy demand. 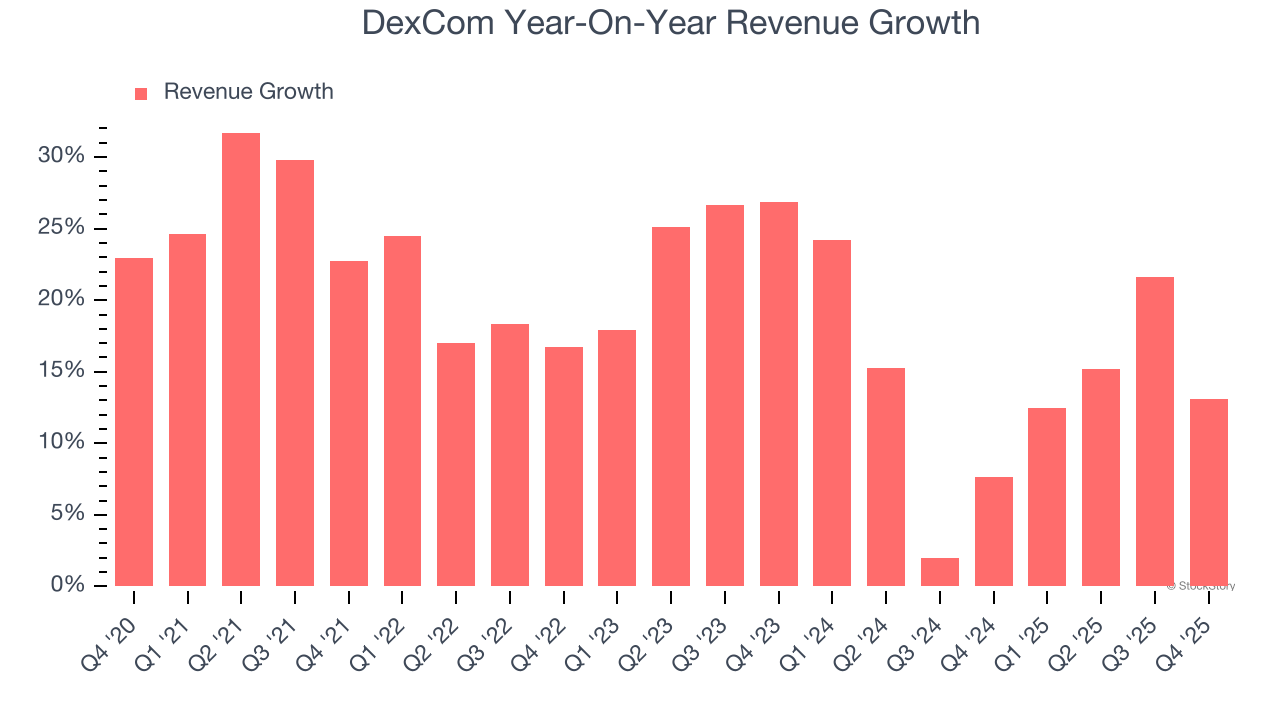
We can dig further into the company’s sales dynamics by analyzing its organic revenue, which strips out one-time events like acquisitions and currency fluctuations that don’t accurately reflect its fundamentals. Over the last two years, DexCom’s organic revenue averaged 14.1% year-on-year growth. Because this number aligns with its two-year revenue growth, we can see the company’s core operations (not acquisitions and divestitures) drove most of its results. 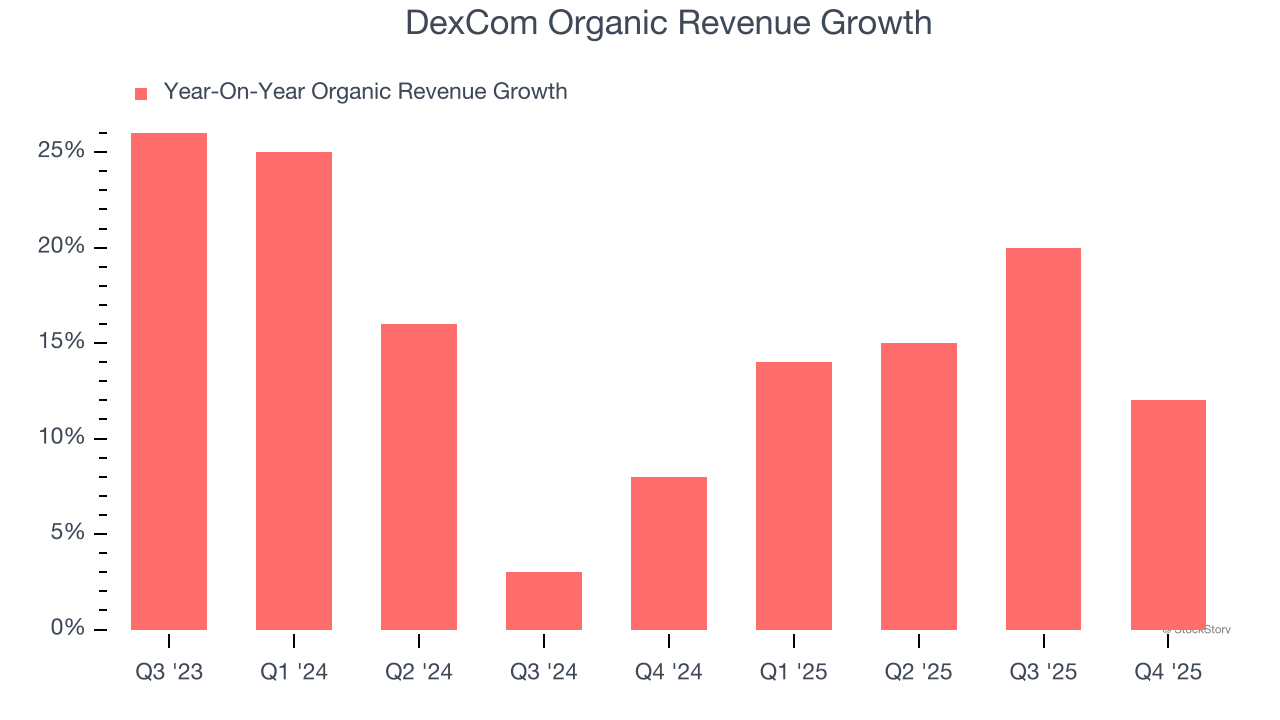
This quarter, DexCom reported year-on-year revenue growth of 13.1%, and its $1.26 billion of revenue exceeded Wall Street’s estimates by 0.8%.
Looking ahead, sell-side analysts expect revenue to grow 12.3% over the next 12 months, similar to its two-year rate. Despite the slowdown, this projection is admirable and suggests the market sees success for its products and services.
The 1999 book Gorilla Game predicted Microsoft and Apple would dominate tech before it happened. Its thesis? Identify the platform winners early. Today, enterprise software companies embedding generative AI are becoming the new gorillas. a profitable, fast-growing enterprise software stock that is already riding the automation wave and looking to catch the generative AI next.
Operating Margin
DexCom has managed its cost base well over the last five years. It demonstrated solid profitability for a healthcare business, producing an average operating margin of 15.7%.
Analyzing the trend in its profitability, DexCom’s operating margin rose by 8.7 percentage points over the last five years, as its sales growth gave it operating leverage. Zooming in on its more recent performance, we can see the company’s trajectory is intact as its margin has also increased by 3.1 percentage points on a two-year basis. These data points are very encouraging and show momentum is on its side.
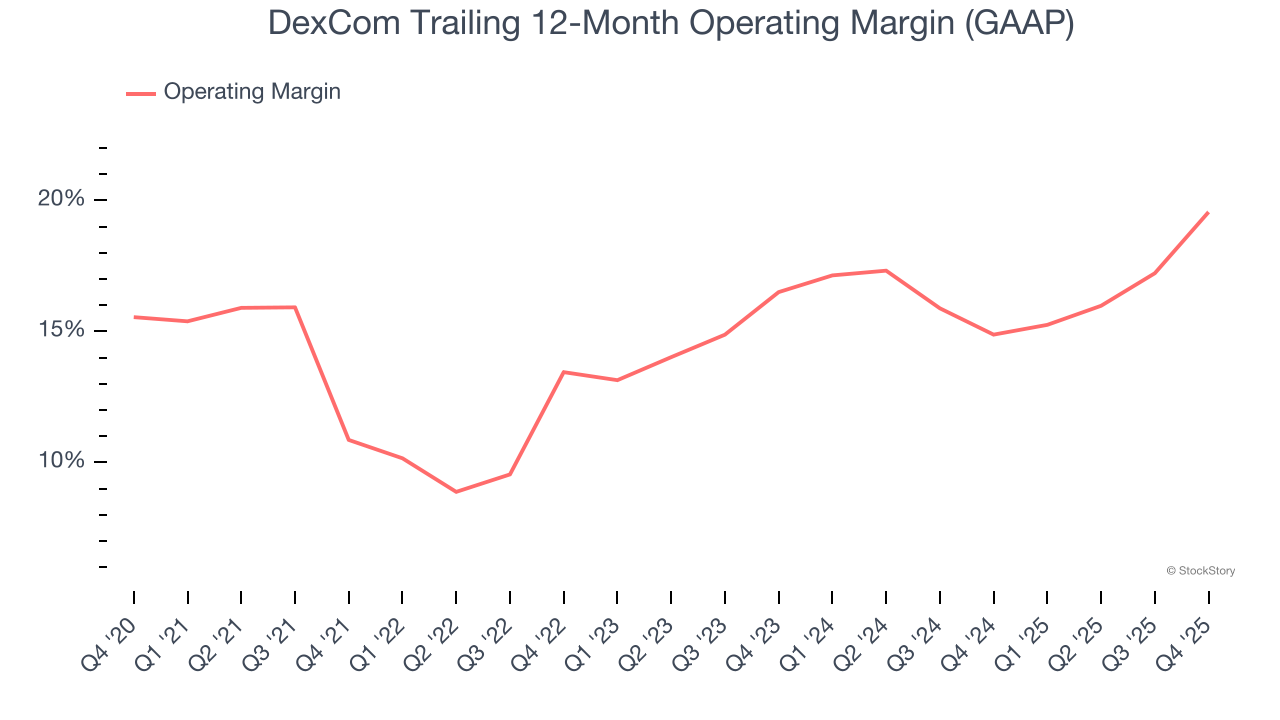
This quarter, DexCom generated an operating margin profit margin of 25.6%, up 8.7 percentage points year on year. This increase was a welcome development and shows it was more efficient.
Earnings Per Share
We track the long-term change in earnings per share (EPS) for the same reason as long-term revenue growth. Compared to revenue, however, EPS highlights whether a company’s growth is profitable.
DexCom’s EPS grew at an astounding 22.1% compounded annual growth rate over the last five years, higher than its 19.3% annualized revenue growth. This tells us the company became more profitable on a per-share basis as it expanded.
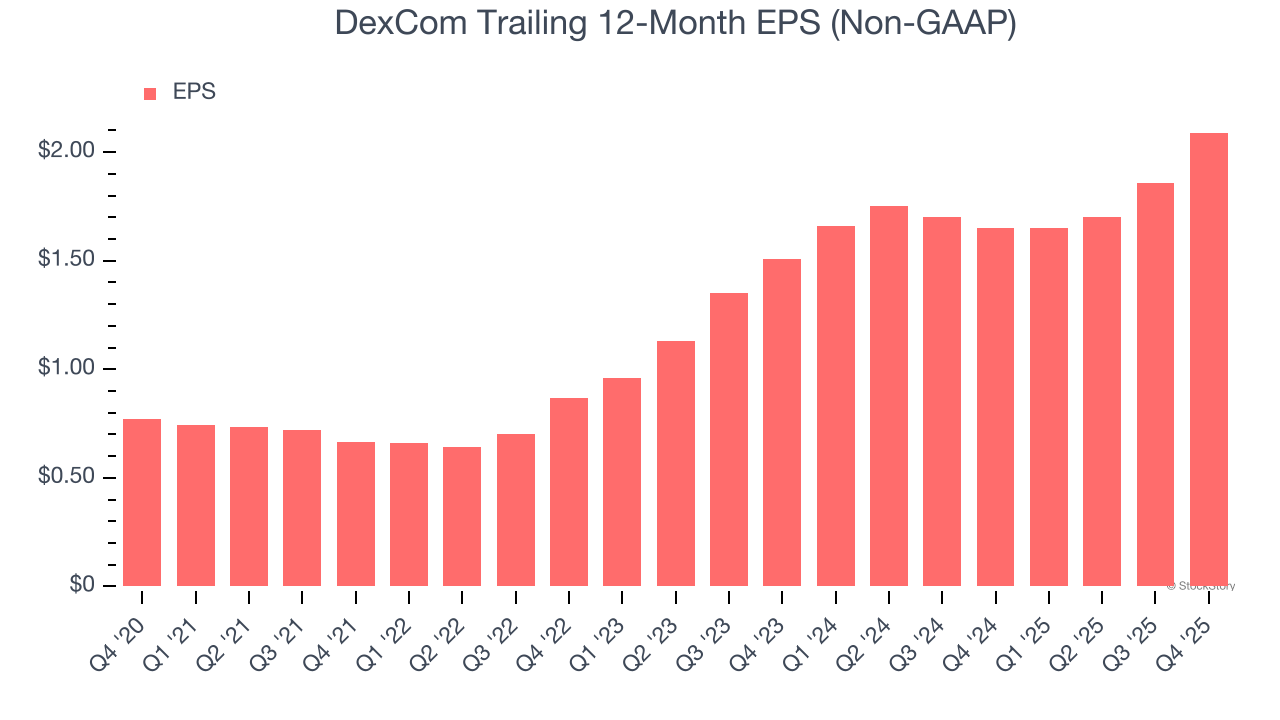
Diving into the nuances of DexCom’s earnings can give us a better understanding of its performance. As we mentioned earlier, DexCom’s operating margin expanded by 8.7 percentage points over the last five years. On top of that, its share count shrank by 4.4%. These are positive signs for shareholders because improving profitability and share buybacks turbocharge EPS growth relative to revenue growth. 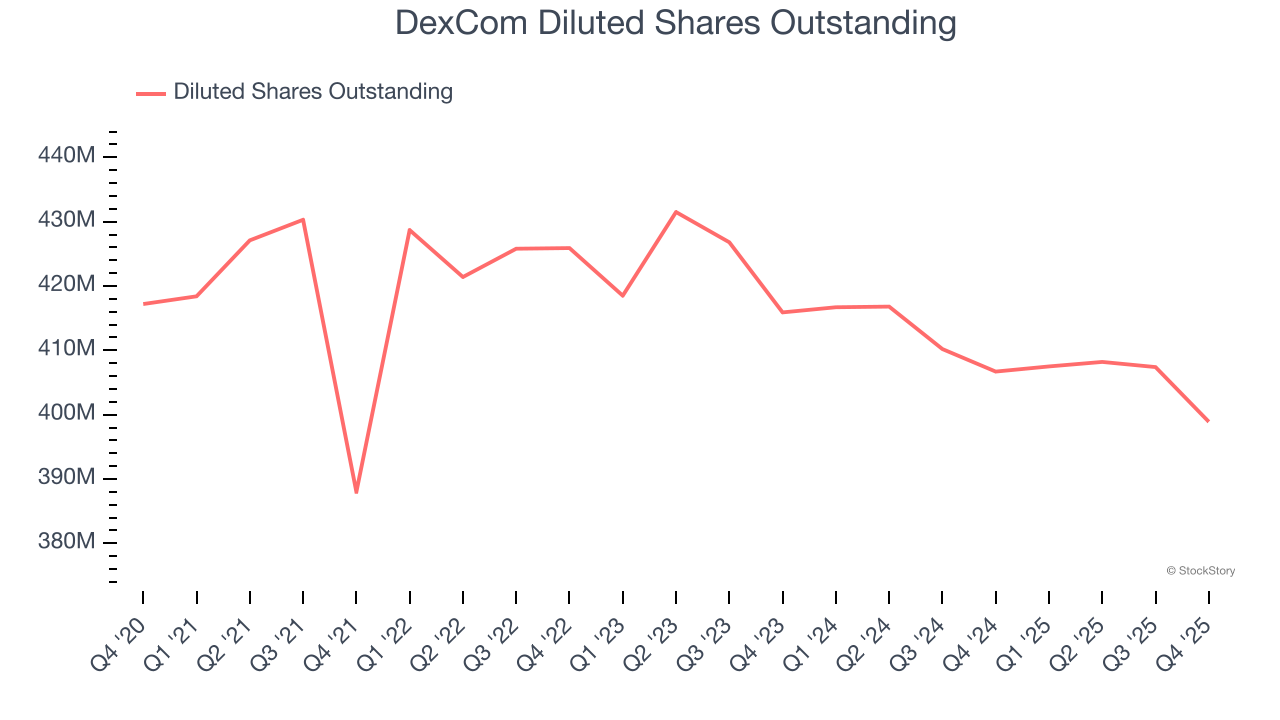
In Q4, DexCom reported adjusted EPS of $0.68, up from $0.45 in the same quarter last year. This print beat analysts’ estimates by 4.5%. Over the next 12 months, Wall Street expects DexCom’s full-year EPS of $2.09 to grow 18.4%.
Key Takeaways from DexCom’s Q4 Results
It was good to see DexCom beat analysts’ EPS expectations this quarter. We were also happy its revenue narrowly outperformed Wall Street’s estimates. On the other hand, its full-year revenue guidance was in line. Zooming out, we think this was a mixed quarter. The stock remained flat at $65.12 immediately following the results.
Big picture, is DexCom a buy here and now? We think that the latest quarter is only one piece of the longer-term business quality puzzle. Quality, when combined with valuation, can help determine if the stock is a buy. We cover that in our actionable full research report which you can read here (it’s free).